Were Humans Present in the Area During the Ice Age Floods?

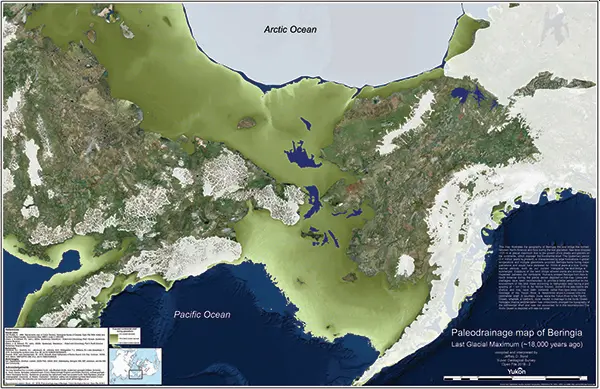
During the last ice age, humans ventured into two vast and completely unknown continents: North and South America. For nearly a century, researchers thought they knew how this wild journey occurred: The first people to cross the Bering Land Bridge, a massive swath of land that connected Asia with North America when sea levels were lower, were the Clovis, who made the journey shortly before 13,000 years ago. According to the Clovis First theory, every Indigenous person in the Americas could be traced to this single, inland migration, said Loren Davis, a professor of anthropology at Oregon State University. But in recent decades, several discoveries have revealed that humans first reached the so-called New World thousands of years before we initially thought and probably didn’t get there by an inland route. So who were the first Americans, and how and when did they arrive? Genetic studies suggest that the first people to arrive in the Americas descend from an ancestral group of Ancient North Siberians and East Asians that mingled around 20,000 to 23,000 years ago and crossed the Bering Land Bridge sometime between then and 15,500 years ago. Geneticists studying the first Americans tend to paint a more consistent picture than archaeologists do, mainly because they’re using the same human remains and genetic datasets. Genetic analyses have found that Ancient North Siberians and a group of East Asians paired up around 20,000 to 23,000 years ago. Soon after, the population split into two genetically distinct groups: one that stayed in Siberia, and another, the basal American branch, which emerged around 20,000 to 21,000 years ago. Genetic data suggest the descendants of this basal American branch crossed the Bering Land Bridge and became the first Americans. But some archaeological sites hint that people may have reached the Americas far earlier than that. There are fossilized human footprints in White Sands National Park in New Mexico that may date to 21,000 to 23,000 years ago. That would mean humans arrived in North America during the Last Glacial Maximum (LGM), which occurred between about 26,500 to 19,000 years ago, when ice sheets covered much of what is now Alaska, Canada and the northern U.S. Other, more equivocal data suggest the first people arrived in the Western Hemisphere by 25,000 or even 31,500, years ago. If these dates can be confirmed, they would paint a much more complex picture of how and when humans reached the Americas. Almost all scientists agree, however, that this incredible journey was made possible by the emergence of Beringia — a now-submerged, 1,100-mile-wide (1,800 kilometers) landmass that connected what is now Alaska and the Russian Far East. During the last ice age, much of Earth’s water was frozen in ice sheets, causing ocean levels to fall. Beringia surfaced once waters in the North Pacific dropped roughly 164 feet (50 meters) below today’s levels; it was passable by foot between 30,000 and 12,000 years ago. From there, the archaeological picture gets muddier. The older version of the story originated in the 1920s and 1930s, when Western archaeologists discovered sharp-edged, leaf-shaped stone spear points near Clovis, New Mexico. The people who made them, now dubbed the Clovis people, lived in North America between 13,000 and 12,700 years ago, based on a 2020 analysis of bone, charcoal and plant remains found at Clovis sites. At the time, it was thought that the Clovis traveled across Beringia and then moved through an ice-free corridor, or “a gap between the continental ice sheets,” in what is now part of Alaska and Canada. However, new discoveries have turned back the clock on the first Americans’ arrival. In 1976, researchers learned about the site of Monte Verde II in southern Chile, which radiocarbon dating showed was about 14,550 years old. It took decades for archaeologists to accept the dating of Monte Verde, but soon, other sites also pushed back the date of humans’ arrival in the Americas. The Paisley Caves in Oregon contain human coprolites, or fossilized poop, dating to about 14,500 years ago. Page-Ladson, a pre-Clovis site in Florida with stone tools and mastodon bones, dates to about 14,550 years ago. And Cooper’s Ferry — a site that includes stone tools, animal bones and charcoal — dates to around 16,000 years ago. Then, in 2021, scientists announced much more ancient traces of human occupation: fossilized footprints in White Sands, New Mexico dating to between 21,000 and 23,000 years ago. Sites such as White Sands and Cooper’s Ferry have big implications for how the first people arrived in the Americas. It’s thought that the ice-free corridor through North America didn’t fully open until about 13,800 years ago. So if humans were in the Americas long before then, they likely traveled there along the Pacific coast. That coastal journey could have been made by foot, by watercraft, or both. But no fossil or archaeological evidence of this journey has been unearthed. Ideally, archaeologists would like to find more sites from all of these branches, especially any remains that could explain the genetics behind the people at White Sands between 23,000 and 21,000 years ago. Evidence of these long-lost people can be found in the remains of the animals they butchered, the charcoal they burned, the tools they crafted and the loved ones they buried. Local Indigenous Peoples’ stories strongly suggest humans were in the area during the Ice Age Floods, but tangible scientific evidence is sparse and yet to be found in the area. Eedited from a Live Science article by Laura Geggel
Mima/Desert/Biscuit Mounds – An (Possible) Explanation

If you’ve visited the Rowena Crest Viewpoint at Tom McCall Preserve, west of The Dalles in the Columbia River Gorge, you may have noticed the many dome-shaped earthen mounds that cover the Rowena Plateau. These mounds are broadly circular and are surrounded by collections of basalt rock fragments. If you’ve visited the spring wildflower mecca of Catherine Creek on the Washington side of the Gorge, you may have also wondered at what caused the stripes of black rock extending down the slopes above the area. Tens of thousands of similar soil mounds cover large areas of the high desert lands of north-central Oregon, often in swarms that number in the hundreds. These mounds can be round or elongated, can range from a dozen feet to more than 60 feet in diameter atop the rocky Columbia River Basalt bedrock, and are typically surrounded and separated from each other by rings or stripes of basalt rock fragments. The mounds also appear similar to those at Mima Mounds Natural Area Preserve near Olympia, WA. There have been many suggested causes for the creation of these mounds, from burial mounds, to Pleistocene pocket gophers, to plants or glacial sun cups trapping wind-blown sediment, to sorting by earthquake vibrations, to turbulence at the base of ice-age floods flowing over the landscape. Research by two Oregon graduate students, Clark Nelson of Oregon State University and John Baine Pyrch of Portland State University, independently came up with what may be the most likely explanation for the origins of these enigmatic features. Their theses suggest desert mounds and their rock rings formed through a process of natural sorting, where fine soil material is pushed up into mounds and associated rocks are pushed out to the edges to form rings through countless cycles of wetting/drying and freeze/thaw during the wetter and colder period of the late Pleistocene. Clark Nelson cut a trench through a mound that exposed layers of soil and volcanic ash whose lack of mixing discounts the pocket gopher theory. Nelson also found that slope angle less than or greater than 10 degrees determined whether the features would form rounded mounds vs. elongated stripes. Pyrch showed the strips to be distinct from common talus slopes, because no obvious source of rock exists at the head of the talus stripe. He also observed that rocks within these stripes are sorted, unlike talus slopes, suggesting the same ice age freeze-thaw origins as soil mounds and rock rings. You can read more detailed articles about these enigmatic features in these articles: Mystery of the Desert Mounds Great Pyramids of the Gophers: Mima Mound Mystery Solved Similar processes are also thought to be responsible for the “patterned ground” found in periglacial environs. However these various types of features may have formed, we can be certain how the few mounds in the center of the parking circle at Rowena Crest Viewpoint came to be. They were man-made during the construction of the viewpoint and made to look like the mounds that cover the Rowena Plateau. At least one origin has a definitive answer.
Bone Pendants Suggest Humans in South America 25,000 Years Ago
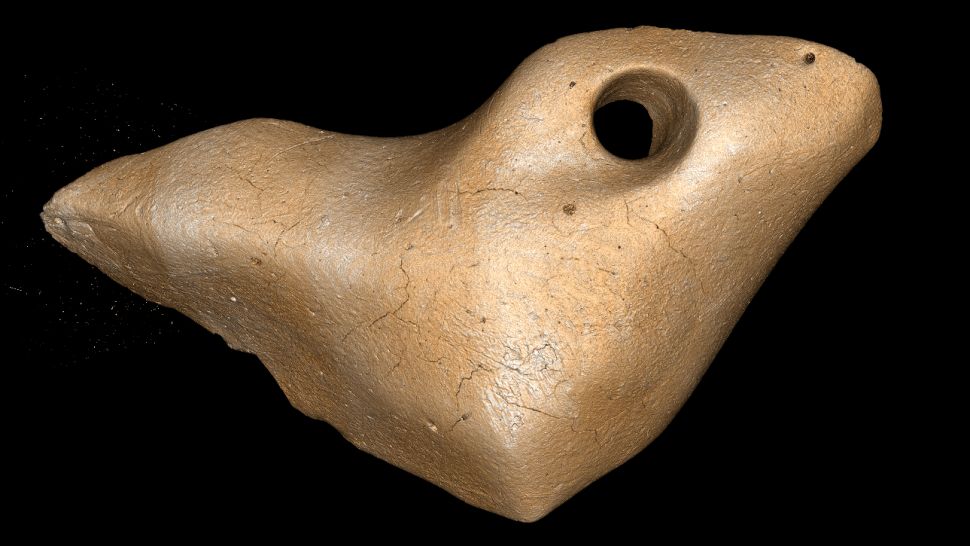
The date that humans arrived in South America has been pushed back to at least 25,000 years ago, based on an unlikely source: bones from an extinct giant ground sloth that were crafted into pendants by ancient people. The presence of human-modified sloth bones in association with stone tools from geological layers that date to 25,000 to 27,000 years ago is strong evidence that people arrived in South America far earlier than previously assumed. Discovered in the Santa Elina rock shelter in central Brazil, three sloth osteoderms — bony deposits that form a kind of protective armor over the skin of animals such as armadillos — found near stone tools sported tiny holes that only humans could have made. The finding is among the earliest evidence for humans in the Americas, according to a paper published July 12 in the journal Proceedings of the Royal Society B. The Santa Elina rock shelter, located in the Mato Grosso state in central Brazil, has been studied by archaeologists since 1985. Previous research at the site noted the presence of more than 1,000 individual figures and signs drawn on the walls, hundreds of stone tool artifacts, and thousands of sloth osteoderms, with three of the osteoderms showing evidence of human-created drill holes. The newly published study documents these sloth osteoderms in exquisite detail to show that it is extremely unlikely that the holes in the bones were made naturally, with the implication that these bones push back the date humans settled in Brazil to 25,000 to 27,000 years ago. These dates are significant because of the growing — but still controversial — evidence for very early human occupation in South America, such as a date of 22,000 years ago for the Toca da Tira Peia rock shelter in eastern Brazil. Using a combination of microscopic and macroscopic visualization techniques, the team discovered that the osteoderms, and even their tiny holes, had been polished, and noted traces of stone tool incisions and scraping marks on the artifacts. Animal-made bite marks on all three osteoderms led them to exclude rodents as the creators of the holes. “These observations show that these three osteoderms were modified by humans into artefacts, probably personal ornaments,” the researchers wrote in their paper. Edited from Live Science article by Kristina Killgrove
The Oldest Stone Tools Ever Found in the US

Indigenous people have been in the Americas longer than archaeologists once thought. Stone tools unearthed from a rock shelter in Southern Oregon were last used more than 18,000 years ago, radiocarbon dating suggests. That makes the site one of the oldest-known human living spaces in the Americas. Buried deep beneath a layer of volcanic ash, archaeologists excavating Rimrock Draw Rockshelter found two stone scraping tools, which ancient knappers had skillfully shaped from pieces of orange agate. A residue of dried bison blood still clung to the edges of one scraper, a remnant of the last bit of work some ancient person had done with the tool before discarding it. The layer of volcanic ash above the tools had blasted out of Mount St. Helens, a few hundred kilometers north of the rock shelter, 15,000 years ago, long after the fine agate scrapers, and the people who made and used them, had been forgotten. In a layer of dirt below the volcanic ash but above the stone tools, archaeologists found broken teeth from now-extinct relatives of modern camels and bison. Radiocarbon dating on a piece of bison tooth enamel (first in 2012, and confirmed recently by more testing) suggests the teeth belonged to animals that lived about 18,250 years ago. And because those teeth were buried in a layer of dirt above the stone tools, they must have ended up in Rimrock Draw sometime after the tools. That makes the agate scraper, complete with bloody evidence of its use, more than 18,000 years old—and one of the oldest traces of human presence in North America. But the people who lived in Oregon more than 18,000 years ago almost certainly weren’t the first to call the continent home. In Idaho, the Nimiipuu (Nez Perce) know the Cooper’s Ferry archaeological site as the ancient location of a village they call Nipehe. The oldest artifacts unearthed at the site date to at least 16,000 years ago, and it looks like people lived there, at least off and on, for several thousand years after those first arrivals. To have reached Cooper’s Ferry 16,000 years ago, the ancient inhabitants of Nipehe would have had to cross Beringia, a land mass that connected what’s now Russia with what’s now Canada during the last Ice Age, when sea levels were lower. They then had to move south along the Pacific Coast of North America, skirting along the western edge of the great ice sheet, until they reached the southern edge of the ice. The ice-free corridor wouldn’t open until about 15,000 to 14,000 years ago. By then, people were already living far, far south of the ice: Archaeologists found stone tools and butchered mastodon bones submerged in a Florida sinkhole that dated back to 14,500 years ago. And in Chile, someone left behind a single footprint 14,600 years ago. Thanks to footprints on an island off the coast of what’s now British Columbia, we know that at least some people did make their way along the coasts about 13,000 years ago. But some archaeologists, like Bournemouth University’s Matthew Bennett and his colleagues, say that those coastal migrants may have found their way into a continent already home to people who arrived at least 26,000 years ago—long before the ice sheets blocked the way into North America from Asia. In the mountains of north-central Mexico, archaeologists unearthed stone tools from Chiquihuite Cave, which dated back to around 30,000 years ago. And at White Sands National Monument in New Mexico, it appears that someone walked along the ancient shoreline of Lake Otero (now long since dry) between 23,000 and 21,000 years ago, leaving behind a trail of 61 footprints. Archaeologists dated the White Sands footprints thanks to grass seeds trapped in the layers of clay and silt above and below the tracks, which helped bracket their possible age. Some archaeologists are still skeptical, partly because there are so few sites this old south of the ice sheets, but there’s enough evidence to take the claims seriously. Taken from an article by KIONA N. SMITH published in arsTechnica
Modeling Time: Human, Geologic, Cosmologic

It’s difficult for most people to grasp the immensity of time as it’s viewed by archeologists, much less as it’s viewed by geologist or cosmologists. One way often used by those scientists to model time in terms that others can visualize is to compare time to distance along a path, with markers to denote specific events and periods. To Scale: TIME is a YouTube video about a group of friends who built a practical scale model of time: 13.8 billion years of cosmic evolution, and our place within it, on a dry lakebed in the Mojave.
Molten Mush Under Yellowstone Supervolcano

The mantle hotspot now under Yellowstone is thought to have been the source of the voluminous Columbia River Basalts that erupted from 17 to 6 million years ago as the North American continent passed over the hotspot, and that now underlie much of the path of the Ice Age Floods. During and since that time the hotspot cut a long and explosive path from the Oregon/Nevada/California border across the Snake River Plain, but ongoing research appears to show it to be fairly stable for at least our brief geologic time. A new study has found the amount of melted rock beneath Yellowstone’s supervolcano is far higher than previous estimates. Scientists have worked out the consistency of the magma under the Yellowstone caldera using seismic waves — and the reservoir is filled with “mush” that doesn’t pose an imminent eruption threat. While researchers say there is no sign of an imminent eruption, the discovery provides a more detailed view of what’s going on in the enormous magma chamber that sits beneath the national park. Far from a smooth blend of molten rock, magma reservoirs contain a large amount of solid rock, semi-liquid crystals, gasses and other volatile substances. This “magmatic mush” is highly dynamic but tends to burst out from deep underground when the proportion of liquid — or melt — crosses a certain threshold. Previous work suggests that eruptions typically occur when at least 50% of the space in the upper magma reservoir — a layer of flattened pockets of magma stacked on top of each other — is filled with melt. The magma reservoir beneath Yellowstone volcano consists of two chambers — a shallow reservoir near the surface that’s around 55 miles (90 kilometers) long and 25 miles (40 km) wide, and a deeper chamber that is about 4.5 times larger. While the deeper reservoir contains about 2% melt, the upper chamber contains far more: A study published in Science in December 2022 put the proportion of melt between 16% and 20%. Now, Sin-Mei Wu, a geophysicist and postdoctoral researcher with the Swiss Seismological Service at the Federal Institute of Technology (ETH) in Zurich, and colleagues have found the percentage is much higher. The team used seismic wave data to assess the texture and composition of the upper magma reservoir, which is about 3 miles (5 km) deep at Yellowstone. The results, published June 8 in the journal Earth and Planetary Science Letters, indicate the upper chamber consists of 28% melt — 8% to 12% more than the 2022 estimate, which was found with different methods, Wu said. “What we found is that the portion of liquid phase is not enough to have an imminent eruption,” Wu told Live Science. “Although we found a much higher portion of liquid than what was previously found, it’s still only up to 28%. So, to the best of our knowledge, Yellowstone will not have an imminent eruption.” Working out the proportion of liquid in magma reservoirs could help scientists evaluate the risk of volcanic eruptions elsewhere. “It’s important to understand the eruption potential, maybe not for Yellowstone so far, but you can apply the same methods to other magma systems that are more prone to eruption and to some that are already erupting,” Wu said. The methodology used for the study is “revolutionary in the detail and resolution it allowed for,” said Michael Poland, a research geophysicist and scientist-in-charge at the Yellowstone Volcano Observatory. The magma at Yellowstone and in other magmatic systems is like “mush,” Poland told Live Science in an email. “We often refer to ‘magmatic mush’ to convey a sense that it’s not a 100% molten ball, but also contains a lot of solid material — in the case of Yellowstone, way more solid than liquid material,” he added. “Maybe like a really thick lentil soup.” Despite recent breakthroughs, scientists can’t be sure what exactly lurks beneath the supervolcano, Wu said. “We are looking forward to some joint interpretation with other geophysical data to find out, for example, if we only have melt or if there is gas, volatiles, or something else that will help us understand the eruption dynamics.” From an article in Live Science by Sascha Pare
How do we know how old Earth is?
By measuring radioactive elements in rocks from Earth and other parts of the solar system, scientists can develop a timeline of our planet’s early years. Earth is roughly 4.54 billion years old. In that time, it has seen continents form and disappear, ice caps expand and retreat, and life evolve from single-celled organisms into blue whales. But how do we know Earth’s age? We start by looking inside it. “When you’re an Earth scientist who looks at a rock, it’s not just a rock; it’s like that rock has a story that you can try to decipher,” said Becky Flowers, a geologist at the University of Colorado Boulder. When minerals form out of magma or lava, they often contain traces of radioactive material, such as uranium. Over time, those radioactive elements decay, meaning they spew radiation, eventually transforming them into new, more stable elements that remain trapped inside the mineral. Take radioactive uranium-238, a common form of uranium. Its atoms will release energy until they eventually turn into lead. That process occurs at a fixed rate known as a half-life, which corresponds to the amount of time it takes for half of the atoms to decay. The half-life of uranium-238 is more than 4 billion years, meaning it takes more than 4 billion years for half of the uranium-238 in a sample to become lead. This makes it perfect for dating objects that are very, very old. By knowing these half-lives, we can calculate how old a rock is based on the ratio of the “parent” radioactive element and the “daughter” stable element — a method called radiometric dating. The mineral zircon is commonly used for radiometric dating because it contains a relatively large amount of uranium, Flowers said. Uranium-lead dating is just one type of radiometric dating. Other types use different elements; for example, radiocarbon dating, one of the most common methods, uses a radioactive isotope of carbon that has a half-life of thousands of years and is useful for dating organic matter. Using these methods, geologists have found minerals on Earth that date as far back as 4.4 billion years, meaning the planet has been around at least that long. But if scientists say Earth is more than 4.5 billion years old, where did those extra 100 million years or so come from? Earth, as mentioned, has changed a lot over billions of years, especially through processes such as plate tectonics, which shift the crust, birthing new land out of magma and subducting old land back underground. As a result, rocks from the very beginning of the planet’s history are hard to find; they’ve long since eroded or melted back into raw material. But scientists can use radiometric dating to determine the age of rocks from other parts of the solar system, too. Some meteorites contain materials that are more than 4.56 billion years old, and rocks from the moon and Mars have also been dated to around 4.5 billion years ago. Those dates are pretty close to the time scientists think the solar system started to take shape out of the cloud of gas and dust surrounding the newborn sun. And by knowing all of these relative ages, we can start to piece together a timeline of how Earth, the moon, Mars and all of the other little rocks floating around in nearby space started to form. Yet the transition from primordial dust cloud to planet Earth didn’t happen all at once but rather over millions of years, Rebecca Fischer, an Earth and planetary scientist at Harvard University, told Live Science. That means our understanding of Earth’s age will always be less about a specific year when the planet formed and more about a general sense of the era when our home planet started to take shape. By Ethan Freedman (lifes-little-mysteries ) reprinted from LiveScience.com
Geology Experts Find Evidence of Dual Mass Extinctions 260 Million Years Ago

Long before dinosaurs, Earth was dominated by animals that were in many ways even more incredible. Carnivores such as Titanophoneus, or “titanic murderer,” stalked enormous armored reptiles the size of buffalo. Many of these animals died out in a mass extinction during the Capitanian Age approximately 260 million years ago. Now an international team of researchers says evidence suggests this mass extinction was not a single event but two, separated by nearly 3 million years. Both were caused by the same culprit: massive volcanic eruptions. By studying uranium isotope profiles of marine samples collected in the South China Sea, scientists identified two “pulses” in which the oceans became deprived of life-giving oxygen. In a study published in the journal Earth and Planetary Science Letters, researchers say their analysis provides evidence that the oxygen-deprived oceans precipitated two mass extinctions around 259 million and 262 million years ago during the Middle Permian Period. Looming climate disaster By studying these ancient extinctions, researchers can better predict how modern-day global warming could affect the ocean’s food chain. “We are studying the biocrisis in the Permian Period, but similar warming is happening today because of human events,” said Thomas Algeo, a study co-author and University of Cincinnati professor of geosciences. “Humans are mimicking the effects of volcanic eruptions as a consequence of the release of carbon into the atmosphere.” The study was led by researcher Huyue Song at the China University of Geosciences, a former postdoctoral researcher at UC. “Today, we are facing several global change issues, including global warming, ocean hypoxia, seawater acidification and biodiversity decline, which are similar to the environmental changes during the Middle Permian biological crisis interval,” Song said. Scientists have identified the five biggest mass extinctions, including the most cataclysmic of all 252 million years ago called “the great dying” that wiped out 90% of ocean life and 70% of land animals. This disaster, too, was caused by massive volcanic activity that turned the seas into dead zones, said Algeo. “The Capitanian extinctions are not among the Big Five, but they are significant,” Algeo said. How do volcanic eruptions lead to extinctions? Algeo said massive eruptions create a brief period of cooling from ash in the upper atmosphere reflecting sunlight, followed by much longer periods of global warming. The release of massive volumes of greenhouse gases warmed the oceans. The warm surface water did not allow dissolved oxygen to reach lower depths, eventually destroying the food chain. “The ocean is teetering on the edge of anoxia,” he said of this absence of oxygen. “Dissolved oxygen has to be taken up by the surface layer and supplied to the deep ocean. But warmer water is lower density. When you increase the density differential, you prevent any overturn and there’s no way to get dissolved oxygen into the deeper layers.” One way researchers identify these massive volcanic eruptions is by looking for mercury in the sedimentary layers. “Mercury has been shown to be a useful proxy for volcanic eruptions,” Algeo said. “Large volcanic eruptions spew mercury into the atmosphere that gets carried around Earth and deposited in marine sediments.” Scientists say the volcanic eruptions that caused the great dying originated in Siberia. The eruptions that caused the twin mass extinctions in the Permian took place in southwest China in a place known as the Emeishan Large Igneous Province. Algeo said he would like to see if any terrestrial evidence supports the conclusions derived from their study of ancient oceans. He is optimistic that geology will unlock more mysteries about prehistoric life on Earth. “Over the last 40 years we’ve made tremendous strides in understanding the Earth’s past,” Algeo said. “It’s partly because we have all these new tools we can apply. And we have many more people working in this field than we had a generation ago.” Researcher Song said the dual disasters in the Permian show the devastating effects that global warming can have. “We must pay attention to these environmental issues and prevent the sixth mass extinction,” he said. Reprinted from Phys.org, article by Michael Miller, University of Cincinnati
Bering Land Bridge Formed Surprisingly Late During Last Ice Age
By reconstructing the sea level history of the Bering Strait, scientists found that the strait remained flooded and the Bering Land Bridge connecting Asia to North America did not emerge until around 35,700 years ago, less than 10,000 years before the height of the last ice age (known as the Last Glacial Maximum), and not long before humans are thought to have begun migrating into the Americas. The new findings indicate that the growth of the ice sheets—and the resulting drop in sea level—occurred surprisingly quickly and much later in the glacial cycle than previous studies had suggested. “It means that more than 50 percent of the global ice volume at the Last Glacial Maximum grew after 46,000 years ago,” said Tamara Pico, assistant professor of Earth and planetary sciences at UC Santa Cruz and a corresponding author of the paper. “This is important for understanding the feedbacks between climate and ice sheets, because it implies that there was a substantial delay in the development of ice sheets after global temperatures dropped.” Global sea levels drop during ice ages as more and more of Earth’s water gets locked up in massive ice sheets, but the timing of these processes has been hard to pin down. During the Last Glacial Maximum, which lasted from about 26,500 to 19,000 years ago, ice sheets covered large areas of North America. Dramatically lower sea levels uncovered a vast land area known as Beringia that extended from Siberia to Alaska and supported herds of horses, mammoths, and other Pleistocene fauna. As the ice sheets melted, the Bering Strait became flooded again around 13,000 to 11,000 years ago. The new findings are interesting in relation to human migration because they shorten the time between the opening of the land bridge and the arrival of humans in the Americas. The timing of human migration into North America remains unresolved, but some studies suggest people may have lived in Beringia throughout the height of the ice age. “People may have started going across as soon as the land bridge formed,” Pico said. The new study used an analysis of nitrogen isotopes in seafloor sediments to determine when the Bering Strait was flooded during the past 46,000 years, allowing Pacific Ocean water to flow into the Arctic Ocean. First author Jesse Farmer at Princeton University led the isotope analysis, measuring nitrogen isotope ratios in the remains of marine plankton preserved in sediment cores collected from the seafloor at three locations in the western Arctic Ocean. Because of differences in the nitrogen composition of Pacific and Arctic waters, Farmer was able to identify a nitrogen isotope signature indicating when Pacific water flowed into the Arctic. Pico, whose expertise is in sea level modeling, then compared Farmer’s results with sea level models based on different scenarios for the growth of the ice sheets. “The exciting thing to me is that this provides a completely independent constraint on global sea level during this time period,” Pico said. “Some of the ice sheet histories that have been proposed differ by quite a lot, and we were able to look at what the predicted sea level would be at the Bering Strait and see which ones are consistent with the nitrogen data.” The results support recent studies indicating that global sea levels were much higher prior to the Last Glacial Maximum than previous estimates had suggested, she said. Average global sea level during the Last Glacial Maximum was about 130 meters (425 feet) lower than today. The actual sea level at a particular site such as the Bering Strait, however, depends on factors such as the deformation of the Earth’s crust by the weight of the ice sheets. “It’s like punching down on bread dough—the crust sinks under the ice and rises up around the edges,” Pico said. “Also, the ice sheets are so massive they have gravitational effects on the water. I model those processes to see how sea level would vary around the world and, in this case, to look at the Bering Strait.” The findings imply a complicated relationship between climate and global ice volume and suggest new avenues for investigating the mechanisms underlying glacial cycles. In addition to Pico and Farmer, the coauthors include Ona Underwood and Daniel Sigman at Princeton University; Rebecca Cleveland-Stout at the University of Washington; Julie Granger at the University of Connecticut; Thomas Cronin at the U.S. Geological Survey; and François Fripiat, Alfredo Martinez-Garcia, and Gerald Haug at the Max Planck Institute for Chemistry in Germany. This work was supported by the National Science Foundation. Published in Proceedings of the National Academy of Sciences. Reprinted from UC Santa Cruz Newsletter, By Tim Stephens
OSU Archaeologists Find Oldest Known Projectile Points in the Americas

Oregon State University archaeologists have uncovered projectile points in Idaho that are thousands of years older than any previously found in the Americas, helping to fill in the history of how early humans crafted and used stone weapons. The 13 full and fragmentary projectile points, razor sharp and ranging from about half an inch to 2 inches long, are from roughly 15,700 years ago, according to carbon-14 dating. That’s about 3,000 years older than the Clovis fluted points found throughout North America, and 2,300 years older than the points previously found at the same Cooper’s Ferry site along the Salmon River in present-day Idaho. “From a scientific point of view, these discoveries add very important details about what the archaeologic al record of the earliest peoples of the Americas looks like,” said Loren Davis, an anthropology professor at OSU and head of the group that found the points. “It’s one thing to say, ‘We think that people were here in the Americas 16,000 years ago;’ it’s another thing to measure it by finding well-made artifacts they left behind.” Previously, Davis and other researchers working the Cooper’s Ferry site had found simple flakes and pieces of bone that indicated human presence about 16,000 years ago. But the discovery of projectile points reveals new insights into the way the first Americans expressed complex thoughts through technology at that time, Davis said. The Salmon River site where the points were found is on traditional Nez Perce land, known to the tribe as the ancient village of Nipéhe. The land is currently held in public ownership by the federal Bureau of Land Management. The points are revelatory not just in their age, but in their similarity to projectile points found in Hokkaido, Japan, dating to 16,000-20,000 years ago, Davis said. Their presence in Idaho adds more detail to the hypothesis that there are early genetic and cultural connections between the ice age peoples of Northeast Asia and North America. “The earliest peoples of North America possessed cultural knowledge that they used to survive and thrive over time. Some of this knowledge can be seen in the way people made stone tools, such as the projectile points found at the Cooper’s Ferry site,” Davis said. “By comparing these points with other sites of the same age and older, we can infer the spatial extents of social networks where this technological knowledge was shared between peoples.” These slender projectile points are characterized by two distinct ends, one sharpened and one stemmed, as well as a symmetrical beveled shape if looked at head-on. They were likely attached to darts, rather than arrows or spears, and despite the small size, they were deadly weapons, Davis said. “There’s an assumption that early projectile points had to be big to kill large game; however, smaller projectile points mounted on darts will penetrate deeply and cause tremendous internal damage,” he said. “You can hunt any animal we know about with weapons like these.” These discoveries add to the emerging picture of early human life in the Pacific Northwest, Davis said. “Finding a site where people made pits and stored complete and broken projectile points nearly 16,000 years ago gives us valuable details about the lives of our region’s earliest inhabitants.” The newly discovered pits are part of the larger Cooper’s Ferry record, where Davis and colleagues have previously reported a 14,200-year-old fire pit and a food-processing area containing the remains of an extinct horse. All told, they found and mapped more than 65,000 items, recording their locations to the millimeter for precise documentation. The projectile points were uncovered over multiple summers between 2012 and 2017, with work supported by a funding partnership held between OSU and the BLM. All excavation work has been completed and the site is now covered. The BLM installed interpretive panels and a kiosk at the site to describe the work. Davis has been studying the Cooper’s Ferry site since the 1990s when he was an archaeologist with the BLM. Now, he partners with the BLM to bring undergraduate and graduate students from OSU to work the site in the summer. The team also works closely with the Nez Perce tribe to provide field opportunities for tribal youth and to communicate all findings. The findings were published in the journal Science Advances. Reprinted from Oregon State University Newsroom, STORY BY: Molly Rosbach, SOURCE: Loren Davis