Amazing Forensics Solve 150-Million-Year Pterosaur Mystery
Two tiny pterosaur fossils, each smaller than a mouse, have finally solved a puzzle that has mystified paleontologists for decades. The perfectly preserved hatchlings, nicknamed “Lucky I” and “Lucky II,” were discovered in Germany’s famous Solnhofen limestone formations and reveal both how they died and why juvenile flying reptiles dominate this fossil record. The Tragic Discovery Both Pterodactylus hatchlings, just one to two weeks old when they perished, share a telling characteristic: broken wing bones with identical fracture patterns. The clean, slanted breaks to their humerus bones suggest the same type of twisting force killed them both 150 million years ago. University of Leicester paleontologist Rab Smyth and his team reconstructed their final moments through careful forensic analysis. The evidence points to a violent Late Jurassic storm that battered the tiny pterosaurs with winds so powerful their fragile wing bones snapped under pressure. The same storm then hurled their bodies into a saltwater lagoon, where churning waters quickly carried them to the bottom for rapid burial and exceptional preservation. Solving the Solnhofen Paradox The discovery resolves a long-standing mystery about the Solnhofen formations, which contain hundreds of pterosaur specimens but are dominated by juveniles. This seemed counterintuitive since young pterosaurs had more fragile bones and should be less likely to fossilize than adults. The research reveals this apparent contradiction actually makes perfect sense. The same catastrophic storms that killed vulnerable hatchlings created ideal conditions for their preservation. Adult pterosaurs, being stronger and more experienced, could survive the violent weather that proved fatal to their offspring. When adults eventually died under calm conditions, their remains would float and decompose before sinking, making fossilization unlikely. “For centuries, scientists believed that the Solnhofen lagoon ecosystems were dominated by small pterosaurs,” Smyth explains. “But we now know this view is deeply biased. Many of these pterosaurs weren’t native to the lagoon at all – they were inexperienced juveniles caught up in powerful storms.” Broader Implications This discovery transforms our understanding of pterosaur ecology and fossil preservation. Rather than reflecting true population dynamics, the juvenile-heavy fossil record represents a preservation bias created by extreme weather events. The findings also provide rare insight into Late Jurassic climate patterns, suggesting violent storms regularly impacted ancient ecosystems. The research exemplifies how modern paleontology combines traditional fossil analysis with environmental reconstruction. By examining preservation circumstances alongside the bones themselves, scientists can extract far more information from specimens and avoid misinterpreting ancient ecosystems. Published in Current Biology, this work offers a new framework for understanding how environmental factors influence fossil records – reminding us that every preserved specimen tells a story not just about the creature’s life, but about the dramatic events that led to its preservation across deep time. AI adapted from Original reporting by Michelle Starr, ScienceAlert about research by Rab Smyth and colleagues, University of Leicester..
DNR Releases Stunning Dry Falls Visualization
DNR’s Daniel Coe collaborating with Joel Gombiner has produced a stunning arial oblique visualization and poster showing incredible detail of the Dry Falls geologic complex. The DNR webpage announcing the release also shows additional materials like sliders illustrating differences in image capture resolution and grayscale vs. color representation, as well as Bretz’s scaled line drawing sketch comparing the Dry Falls Complex to Niagara Falls.
“The Next Big One” – NOVA|PBS Short Video
NOVA|PBS is sharing a short 5:16 min) video, THE NEXT “BIG ONE” – The Next Big Earthquake Could Sink Parts of the Pacific Northwest. It contains a brief explanation of the potential timing, causes, and some effects of the impending and widely-feared next Cascadia Earthquake Zone rupture. It’s worth a watch for most anyone in the PacNW.
Greenland’s Subglacial Surprises: How Subglacial Breakouts Might Have Shaped Ice Age Landscapes

Recent discoveries in Greenland are reshaping our understanding of massive flood events beneath ice sheets, offering compelling new perspectives on the formation of some Ice Age Floods-related features. Two recent studies highlight an unprecedented sub-glacial flood in 2014, where a staggering 90 billion liters of meltwater unexpectedly burst through nearly 91 meters (300 feet) of solid ice. This previously undocumented phenomenon in Greenland involved a massive volume of water punching upwards, fracturing the surface, and creating a 2-square-kilometer (0.77 square-mile) crater 85 meters (279 feet) deep. Satellite data revealed that the ice surface dropped dramatically after having bulged from water pressure. Evidence downstream showed a heavily fractured area with large ice boulders and a scoured ice surface, indicative of immense erosive power. This event challenges previous assumptions that the base of ice sheets is always frozen solid and provides critical insights into the destructive potential of sub-glacial meltwater. While the iconic Missoula Floods are well-established as a result of glacial lake outbursts, this Greenland discovery suggests that other, perhaps more localized or intermittent, sub-glacial flood breakouts could have played a significant role in shaping the landscape during past ice ages. Such events could explain certain geomorphological features that don’t neatly fit the Missoula Flood narrative, such as Moses Coulee and possibly much of the Upper Grand Coulee, opening new avenues for research into the diverse origins of Ice Age Floods-related landforms. AI-condensed from articles in LiveScience by Ben Turner and ScienceAlert by Michelle Starr
Hells Canyon Caves Reveal When it was Cut

The origin story of Hells Canyon, North America’s deepest river gorge, has long been unclear to scientists. But new research estimates it formed about 2.1 million years ago when a dramatic flood event likely created a river over the deep gorge. The researchers made the finding after studying clues hidden in the landscape and river deposits preserved in caves. They described their findings in a study published May 19 in the journal PNAS>. Hells Canyon borders Oregon, Idaho and Washington. It’s cut through by the Snake River and is North America’s deepest river gorge, at 10 miles (16 kilometers) wide and about 1.5 miles (2.4 km) deep — almost 2,000 feet deeper than the Grand Canyon. Canyons are inherently difficult to understand and date, said study lead author Matthew Morriss, a geologist at the Utah Geological Survey. “As a river erodes and carves a canyon, it sort of destroys the evidence of its own history,” Morriss told Live Science. But because Hells Canyon is so steep, he guessed it was carved quickly. To find out how the gorge formed, the team examined caves along the side of the canyon. When floods cause rivers to swell, they can deposit sediment into caves where it’s then preserved, Morriss said. The researchers analyzed gravel deposited by the Snake River in three caves along the sides of Hells Canyon, and estimated the age of the deposited material using isotope dating. This enabled the researchers to determine when the river was higher than its current level, which would have been when it was shaping the canyon. The team combined this information with the locations of knickpoints — drastic changes in river steepness where the rivers connect to the gorge — to piece together Hells Canyon’s history. These clues suggest that Hells Canyon formed when water diverted from Lake Idaho into the current route of the gorge to form what’s now the Snake River. The lake may have spilled over because of higher precipitation, or changes to the continental divide, Morriss said. This caused a river to form a path over the area that’s now Hells Canyon, and the water slowly began eroding rock about 5 million years ago, then carved the gorge much more quickly from about 2.1 million years ago. The canyon’s age was unexpected. “The age of the canyon was so much younger than I thought it would be,” Morriss said. “I had no idea it could be as young as 2 million years old — that’s younger than the Grand Canyon, which most people think could be about 5 million years old.” Hells Canyon has a lot in common with the Grand Canyon, according to Karl Karlstrom, geologist at the University of New Mexico whose work focuses on the Grand Canyon, and who was not involved with the new research. “The Grand Canyon and Hells Canyon always get compared to each other,” said Karlstrom. “They’re both big canyons with big rivers at the bottom, they’re about the same length and the same width,” Karlstrom told Live Science, but this study gives a clear picture of Hells Canyon’s distinct history. “To me this paper is a good hypothesis, and it paves the way for next generations of work,” Karlstrom said. Dating more caves in the canyon, and integrating other dating methodologies, could refine the findings and make the dates more precise, Karlstrom added. The findings can inform research on other canyons that may have been carved quickly by rivers, Morriss said. Understanding the history of Hells Canyon also gives insight into how the canyon’s formation shaped the surrounding ecosystem, as some animal species are divided by the canyon and others connected across it. Many landscape features of the southwestern U.S., like Hells Canyon and the Grand Canyon, are younger than previously expected. “[The] Western U.S. has a young and ever changing landscape that has been reshaped in the past few million years and is currently still adjusting,” Karlstrom said. This shows just how quickly — on the scale of geological time — a landscape can dramatically change, he noted. LiveScience article by Olivia Ferrari
Anthropoclastite – Rock Formed in 35 Years or Less

New research reveals industrial waste can turn into rock in as little as 35 years, instead of the thousands or millions of years previously assumed. The finding challenges what scientists know about rock formation, revealing an entirely new “anthropoclastic rock cycle.” The scientists found that waste from seaside industrial plants turns into rock especially rapidly due to the ocean water and air, which activate minerals such as calcium and magnesium in the waste, or slag, cementing it together faster than natural sediments. For a couple of hundred years, we’ve understood the rock cycle as a natural process that takes thousands to millions of years but these human-made materials are being incorporated into natural systems and becoming lithified — essentially turning into rock — over the course of decades instead. Researchers dubbed this newly discovered process the “rapid anthropoclastic rock cycle.” The findings challenge long-standing theories about how rocks form and suggest industries have far less time to dispose of their waste properly than previously thought, Owen said in the statement. The research was published April 10 in the journal Geology. Researchers discovered the first clues of turbo slag-to-rock transformation on Derwent Howe, a giant pile of waste from now-closed iron and steelmaking plants on the northwest coast of England. The scientists noticed irregular formations in these slag “cliffs,” prompting them to take a closer look. One sample contained an aluminum can tab, with a design that couldn’t have been manufactured before 1989, embedded in the material that helped the researchers estimate how long it takes for slag to lithify. For the can tab to become encased in rock, the slag must have solidified and lithified in the past 35 years. It’s possible that these processes finished earlier, so 35 years is the maximum time it takes to turn slag into rock. Scientists have previously made similar observations on the coast of Spain in the Gorrondatxe area, the researchers noted in the study, but those observations didn’t come with a time frame. Excerpted from a LiveScience article by Sascha Pare
The Earth – A Brief Overview
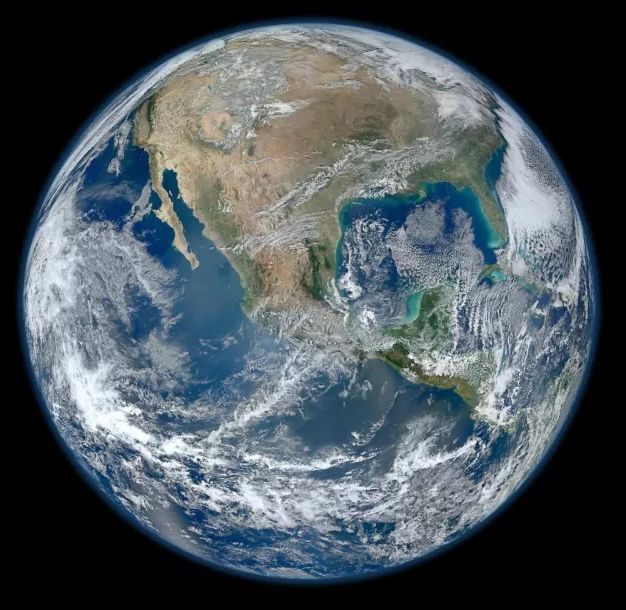
Background The 4.5 billion-year-old Earth is the only known astronomical object to harbor life, giving rise to billions of species of stunning diversity, including ours, Homo sapiens. It has formed the backdrop of an estimated 110 billion human lives. At 13.1 septillion pounds and 25,000 miles in circumference, the third planet from the sun long formed the horizon of all human experience and knowledge (watch overview). Recent discoveries have revealed our home planet’s relative size and location in the universe: a pale blue dot within the Orion Spur, located 26,000 light-years from the center of the Milky Way Galaxy, one of 100,000 galaxies within the Laniakea Supercluster. Formation Early Earth is theorized to have formed alongside the other planets within a solar nebula, where a massive cloud of spinning, interstellar gas and dust contracted under its own gravity and flattened into a hot disk (watch visualization). The core of the disk became dense with lighter elements like hydrogen, eventually heating up and triggering nuclear fusion, forming the sun. Solar wind pushed lighter elements farther out into the system, while heavier metals like iron gathered into increasingly larger masses known as planetismals in a process called accretion to form the Earth and other inner rocky planets. As the protoplanet grew, heat from the colliding material and radioactive decay differentiated Earth’s heavier iron-rich core from its lighter rocky mantle, giving rise to Earth’s magnetic field and long-term stability. Various models suggest Earth’s formation took tens of millions of years. Two billion years later, Earth changed dramatically when cyanobacteria, a microbe, evolved to generate energy from sunlight (i.e., photosynthesis) and release oxygen as a byproduct into the atmosphere during the Great Oxidation Event. Structure and Composition Earth is the densest planet in the solar system and the most massive of the four rocky terrestrials. Shaped into a sphere by gravity, Earth is flattened at its poles and bulges at its equator due to its roughly 1,000-mile-per-hour eastward spin (Jupiter spins 28 times faster). By analyzing seismic waves, researchers theorize that a solid, 9,800-degree Fahrenheit inner core is surrounded by an outer core of liquid iron and nickel—common elements that consolidate into solids at high pressures. Above the core, a slow-moving rocky mantle moves the crust’s tectonic plates, causing volcanoes and earthquakes (see overview). Earth’s spin combines with the core’s electrical conductivity and extreme heat to produce a magnetic field that protects its surface from damaging solar winds, cosmic rays, and deep space radiation. This so-called geodynamo process is expected to last for billions of years. Surface and Climate Situated within the solar system’s “Goldilocks zone,” Earth is the only planet with conditions able to sustain liquid surface water, key to the formation of life. Roughly 71% of its surface is water; the rest is land. An estimated 300 million planets in our galaxy are located in similar zones. The Earth’s five-layer atmosphere traps solar energy and maintains an average global surface temperature of 59 degrees Fahrenheit. Roughly 21% is oxygen, crucial for respiration but highly flammable. Nitrogen (78%) dilutes the oxygen and prevents rapid combustion. Seasons result from the Earth’s 23.4-degree tilt in relation to the orbital plane. Ice ages last millions of years and result from shifting climatic conditions—like ocean currents and the position of tectonic plates—that drop average temperatures by double digits. We live amid the fifth major ice age, though we are in the middle of a warmer interglacial period that began 11,000 years ago.
Video – How Earth Has Changed in 1.8 Billion Years
Among the planets in the Solar System, Earth is unique for having plate tectonics. Mapping our planet through its long history creates a beautiful continental dance — mesmerizing in itself and a work of natural art. This is the first time Earth’s geological record has been used to look so far back in time in an attempt to map the planet over the last 40% of its history. The work, led by Xianzhi Cao from the Ocean University in China, is now published in the open-access journal Geoscience Frontiers. Our planets rocky surface is split into fragments (plates) that grind into each other and create mountains, or split away and form chasms that are then filled with oceans. There are 4.6 billion years of plate motion to investigate, and the rocks we walk over contain the evidence for how Earth has changed over this time. This is a first attempt at mapping the last 1.8 billion years of Earth’s history – a leap forward in the scientific grand challenge to map our world. Modelling our planet’s past is essential if we’re to understand how nutrients became available to power evolution. Apart from causing earthquakes and volcanoes, plate tectonics also pushes up rocks from the deep earth into the heights of mountain ranges. This way, elements which were far underground can erode from the rocks and end up washing into rivers and oceans. From there, living things can make use of these elements. A number of critical metals – like copper and cobalt – are more soluble in oxygen-rich water. In certain conditions, these metals are then precipitated out of the solution: in short, they form ore deposits. Many metals form in the roots of volcanoes that occur along plate margins. By reconstructing where ancient plate boundaries lay through time, we can better understand the tectonic geography of the world and assist mineral explorers in finding ancient metal-rich rocks now buried under much younger mountains. Such a model will allow us to test hypotheses about Earth’s past. For example, why Earth’s climate has gone through extreme “Snowball Earth” fluctuations, or why oxygen built up in the atmosphere when it did. Indeed, it will allow us to much better understand the feedback between the deep planet and the surface systems of Earth that support life as we know it. Excerpted from a Science Alert article by Alan Collins, Professor of Geology, University of Adelaide
A New Class of Plate Tectonics – Lithospheric Dripping
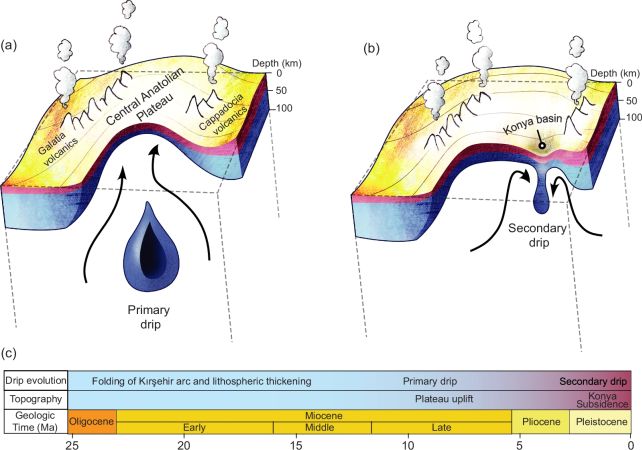
Crinkles and divots in the surface of Earth on Türkiye’s Central Anatolian Plateau are the smoking gun for a newly discovered class of plate tectonics. Beneath a depression called the Konya Basin, Earth’s crust is slowly dripping deeper into the planetary interior, a process that is gradually shaping the surface geology of not just the basin, but the plateau that surrounds it. It’s called lithospheric dripping, a phenomenon that has only recently been discovered here on Earth, and geologists are still figuring out the different ways it manifests. When the lower portion of Earth’s rocky crust is heated to a certain temperature, it starts to go a little gooey. Then, like honey or syrup, it slowly oozes downward – a bit like a pitch drop experiment, but much bigger and slower. As this drop descends, it pulls the planetary crust down with it. This creates a depression, or basin. Then, when the drop detaches into the mantle, the surface rebounds, bulging upwards, with a widespread effect. The Central Anatolian Plateau is known to be uplifting over time. Previous research suggests that it has gained around a kilometer (0.6 miles) in altitude over the past 10 million years thanks to the release of a crusty drip. But then there’s the Konya Basin, which is subsiding downwards at a rate of around 20 millimeters (0.8 inches) per year. That doesn’t sound like much, but a sinking patch of ground in a region that is rising upwards warrants further investigation. The broader region of the plateau is in the throes of the rebound phase of the lithospheric drip process, after having dropped its gooey molten load into the mantle. The Konya Basin? That’s a smaller, second drip forming. “As the lithosphere thickened and dripped below the region, it formed a basin at the surface that later sprang up when the weight below broke off and sank into the deeper depths of the mantle,” says Earth scientist Russell Pysklywec of the University of Toronto. “We now see the process is not a one-time tectonic event and that the initial drip seems to have spawned subsequent daughter events elsewhere in the region, resulting in the curious rapid subsidence of the Konya Basin within the continuously rising plateau of Türkiye.” Excerpt from a Science Alert article By Michelle Starr
Moses Coulee: Unveiling the Mystery of a Colossal Ice Age Scar
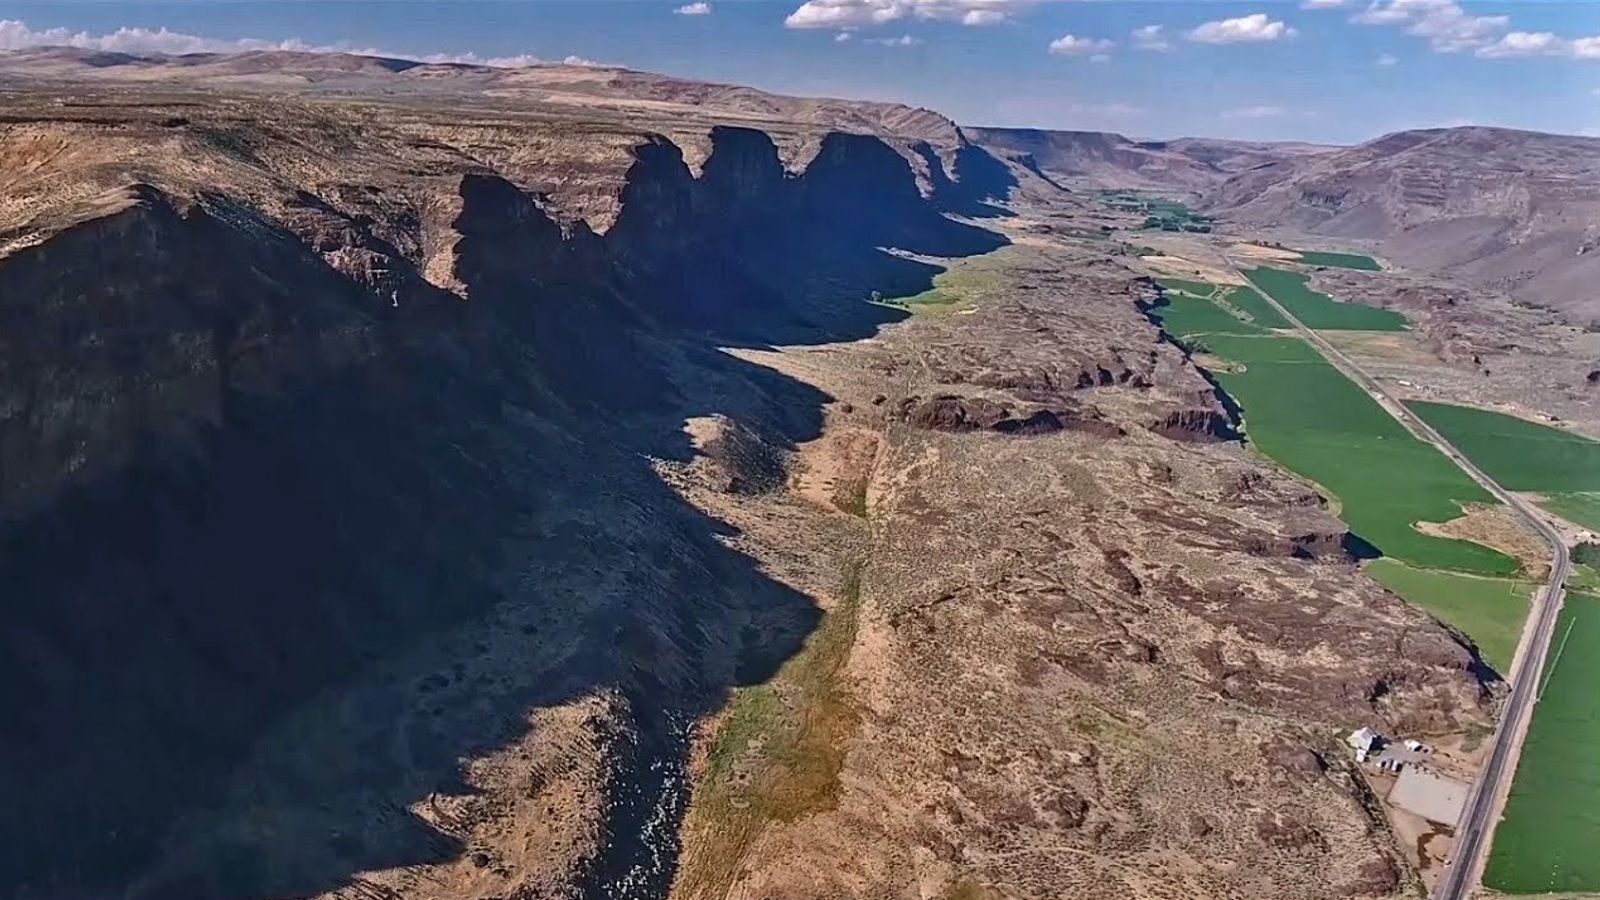
Moses Coulee, a Washington state wonder, has puzzled geologists for over a century. This massive canyon, carved into solid basalt, stands as a testament to some powerful force. The culprit? The Ice Age Floods, a series of catastrophic deluges that reshaped the landscape. If you’ve ever visited, or even just passed through Moses Coulee, you may not have been aware that this awe-inspiring coulee has been an Ice Age Floods conundrum since the time geologist J Harlen Bretz first noted it in 1922. The problem? Moses Coulee doesn’t quite fit the picture. As Bretz described it, “The head of Moses Coulee is just north of Grimes Lake. It is an abrupt termination, walled by 100 foot cliffs, identical with the features of channeled scabland which are called abandoned cataracts.” The head of the coulee ends abruptly, lacking any clear connection to the known flood paths. Theorists proposed a missing link, a path obliterated by the Okanagan Ice Lobe, but no evidence of such a grand passage has ever been found. The mystery has persisted and become more enigmatic as Ice Age Floods research has flourished over the years: what colossal force carved this immense coulee? A new study by Gombiner and Lesemann (Geology, 2024) offers a radical new hypothesis. They propose a surprising source for flood waters: meltwater trapped beneath the massive Okanagan Ice Lobe glacier. Imagine the giant Okanagan ice sheet pressing down on the Waterville Plateau. Meltwater pooled in valleys beneath the ice, trapped and pressurized. This water, according to the theory, found a surprising escape route. Flowing through a network of hidden channels, it carved its way across intervening ridges and valleys, eventually funneling into Moses Coulee. This “tunnel channel network,” as the researchers describe it, explains the unusual path of the water. The channels themselves, carved in basalt, climb slopes and defy normal drainage patterns. These features, along with glacial landforms like eskers, suggest a watery escape route beneath the ice sheet. The study doesn’t rule out the role of traditional Ice Age Floods. Water from massive glacial lakes might have also contributed to Moses Coulee’s formation by flowing along the eastern edge of the glacier. This new hypothesis could be a game-changer. It suggests a hidden world of pressurized meltwater sculpting the landscape beneath the ice. While the debate continues, one thing is certain: Moses Coulee remains a captivating enigma, a place where the power of water and ice continues to unfold its secrets.