Was the 1700 Cascadia earthquake one or many ruptures?
It’s generally accepted that a massive Cascadia earthquake occurred along the British Columbia-Washington-Oregon-N. California coast on January 26, 1700. The earthquake was a result of a rupture of the plate boundary between the North American plate overriding and subducting the Juan de Fuca plate. The evidence for the magnitude and precise timing of the quake includes tsunami deposits and dendrochronology dating at many places along that coastline, and records of a “ghost” tsunami at several locations in Japan. In a Sept. 24, 2024 presentation for Central Oregon Geoscience Society, Diego Melgar of University of Oregon explained earthquake modeling that is seeking to match the earthquake evidence. It turns out there may be millions of possible scenarios where an initial 8.1 to 9.2 magnitude quake followed by up to 5 lesser magnitude aftershocks up to months later could potentially fit the data. That’s not really good news for the Cascadia region, because multiple giant quakes would be no less hazardous than one enormous one. The geological history of the Cascadia subduction zones suggests that it experiences very large earthquakes every few centuries (between every 240 years and every 500 years). The question now is whether these temblors always occur as a single huge earthquake or if sometimes they’re a series of very big ones. Better understanding the nature of the earthquake(s) is important for estimating future tsunami hazards and for developing building codes, disaster response plans, and other critical earthquake-dependent planning. Diego expects continued modeling that considers data from turbidites and tsunami deposit thicknesses may help narrow the possible scenarios, but he stresses that even an 8.1 magnitude quake can be quite devastating. “The tsunami might not be as large from an 8.1, but the shaking can be really intense,” Melgar said. “It’s just dangerous in a different way. Indeed, a decade in which giant quakes hit every two or three years might even be more devastating to people living in the region than a single quake hitting every few hundred years. That’s why it’s important to get to the bottom of which scenario is more likely.” View the recording of Diego’s presentation here or read the “Was a humongous Cascadia earthquake just one of many?” article in Live Science by Stephanie Pappas here.
J Harlan Bretz – His Personal Memories

Glenn Cruickshank recently met with Dean Kiefer. who shared a copy of J Harlan Bretz’s 4-volume memoirs in scanned .pdf format. Glenn converted them to text that also made them searchable. They are a very interesting read, though a bit stream-of-Bretz-consciousness in some sections. Still historically interesting, and a good add to our repository. Click the links below and enjoy! J Harlan Bretz Memories – Part 1 – 1972 J Harlan Bretz Memories – Part 2 J Harlan Bretz Memories – Part 3 J Harlan Bretz Memories – Part 4 – 1975
Video – How Earth Has Changed in 1.8 Billion Years
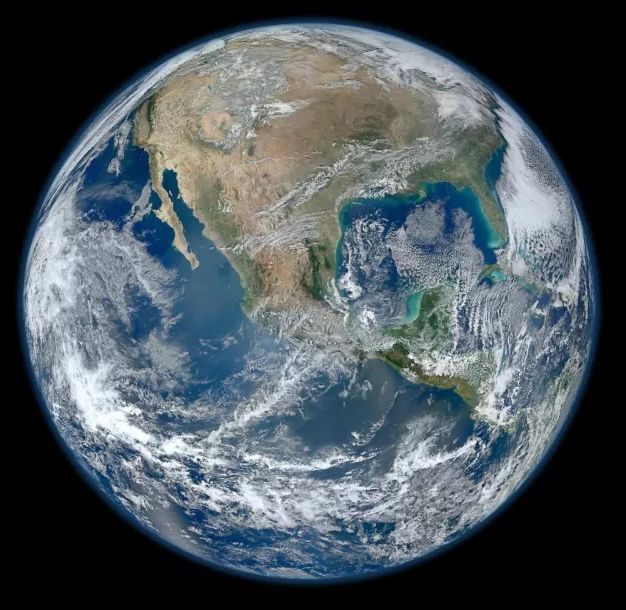
Among the planets in the Solar System, Earth is unique for having plate tectonics. Mapping our planet through its long history creates a beautiful continental dance — mesmerizing in itself and a work of natural art. This is the first time Earth’s geological record has been used to look so far back in time in an attempt to map the planet over the last 40% of its history. The work, led by Xianzhi Cao from the Ocean University in China, is now published in the open-access journal Geoscience Frontiers. Our planets rocky surface is split into fragments (plates) that grind into each other and create mountains, or split away and form chasms that are then filled with oceans. There are 4.6 billion years of plate motion to investigate, and the rocks we walk over contain the evidence for how Earth has changed over this time. This is a first attempt at mapping the last 1.8 billion years of Earth’s history – a leap forward in the scientific grand challenge to map our world. Modelling our planet’s past is essential if we’re to understand how nutrients became available to power evolution. Apart from causing earthquakes and volcanoes, plate tectonics also pushes up rocks from the deep earth into the heights of mountain ranges. This way, elements which were far underground can erode from the rocks and end up washing into rivers and oceans. From there, living things can make use of these elements. A number of critical metals – like copper and cobalt – are more soluble in oxygen-rich water. In certain conditions, these metals are then precipitated out of the solution: in short, they form ore deposits. Many metals form in the roots of volcanoes that occur along plate margins. By reconstructing where ancient plate boundaries lay through time, we can better understand the tectonic geography of the world and assist mineral explorers in finding ancient metal-rich rocks now buried under much younger mountains. Such a model will allow us to test hypotheses about Earth’s past. For example, why Earth’s climate has gone through extreme “Snowball Earth” fluctuations, or why oxygen built up in the atmosphere when it did. Indeed, it will allow us to much better understand the feedback between the deep planet and the surface systems of Earth that support life as we know it. Excerpted from a Science Alert article by Alan Collins, Professor of Geology, University of Adelaide
A New Class of Plate Tectonics – Lithospheric Dripping
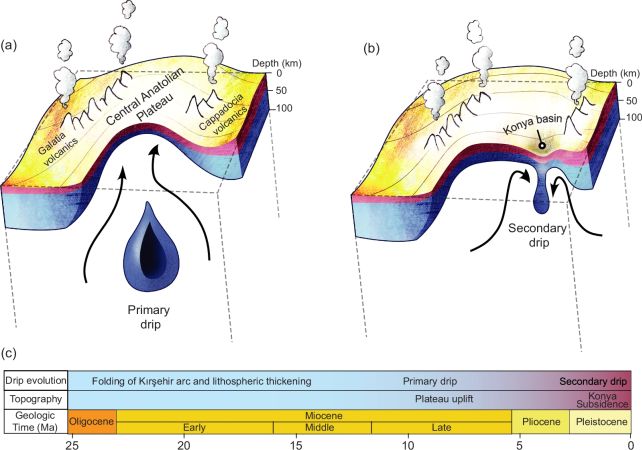
Crinkles and divots in the surface of Earth on Türkiye’s Central Anatolian Plateau are the smoking gun for a newly discovered class of plate tectonics. Beneath a depression called the Konya Basin, Earth’s crust is slowly dripping deeper into the planetary interior, a process that is gradually shaping the surface geology of not just the basin, but the plateau that surrounds it. It’s called lithospheric dripping, a phenomenon that has only recently been discovered here on Earth, and geologists are still figuring out the different ways it manifests. When the lower portion of Earth’s rocky crust is heated to a certain temperature, it starts to go a little gooey. Then, like honey or syrup, it slowly oozes downward – a bit like a pitch drop experiment, but much bigger and slower. As this drop descends, it pulls the planetary crust down with it. This creates a depression, or basin. Then, when the drop detaches into the mantle, the surface rebounds, bulging upwards, with a widespread effect. The Central Anatolian Plateau is known to be uplifting over time. Previous research suggests that it has gained around a kilometer (0.6 miles) in altitude over the past 10 million years thanks to the release of a crusty drip. But then there’s the Konya Basin, which is subsiding downwards at a rate of around 20 millimeters (0.8 inches) per year. That doesn’t sound like much, but a sinking patch of ground in a region that is rising upwards warrants further investigation. The broader region of the plateau is in the throes of the rebound phase of the lithospheric drip process, after having dropped its gooey molten load into the mantle. The Konya Basin? That’s a smaller, second drip forming. “As the lithosphere thickened and dripped below the region, it formed a basin at the surface that later sprang up when the weight below broke off and sank into the deeper depths of the mantle,” says Earth scientist Russell Pysklywec of the University of Toronto. “We now see the process is not a one-time tectonic event and that the initial drip seems to have spawned subsequent daughter events elsewhere in the region, resulting in the curious rapid subsidence of the Konya Basin within the continuously rising plateau of Türkiye.” Excerpt from a Science Alert article By Michelle Starr
Earth’s Climate – Much Warmer Over the Last 485 Million Years

The Washington Post recently published an article about a scientific effort to understand the Earth’s climate over the past 485 million years. The study has revealed a history of wild shifts and far hotter temperatures than scientists previously realized. The study, published in the journal Science, is the most rigorous reconstruction of Earth’s past temperatures ever produced and reveals that the world was in a much warmer state for most of the history of complex animal life on Earth. At its hottest the Earth’s average temperature reached 96.8 degrees Fahrenheit (36 degrees Celsius) — far higher than the recent historic 58.96 F (14.98 C) in humanity’s existence. The timeline illustrates how swift and dramatic temperature shifts were associated with many of the world’s worst moments — including a mass extinction 251 MYA that wiped out roughly 90 percent of all species and the asteroid strike 65 MYA that killed the dinosaurs. The timeline encompasses almost all of the Phanerozoic — the geologic eon that began with the emergence of multicellular, non-microscopic organisms and continues today. It portrays a global climate that was more dynamic and extreme than researchers had imagined and, in keeping with decades of past research on climate, the chart hews closely to estimates of carbon dioxide in the atmosphere, with temperatures rising in proportion to concentrations of the heat-trapping gas. The study also makes clear that the conditions humans are accustomed to are quite different from those that have dominated our planet’s history. For most of the Phanerozoic, the research suggests, average temperatures have exceeded 71.6 F (22 C), with little or no ice at the poles. Coldhouse climates — including our current one — prevailed just 13 percent of the time. One of the more sobering revelations of the research is that life on Earth has endured climates far hotter than the one people are now creating through planet-warming emissions. But humans evolved during the coldest epoch of the Phanerozoic, when global average temperatures were as low as 51.8 F (11 C). The new temperature timeline raises questions as as well as answers, though it is considered more accurate than other estimates. The timeline was assembled through a technique called data assimilation, which combines real-world evidence from 150,000 oceanic data points with climate models to yield more rigorous and accurate results. But it’s also possible that the data assimilation assumes too much warming and is missing factors that might forestall a runaway greenhouse effect. For the billions of people who are now living through the hottest years ever recorded — and facing a hotter future still — the timeline should serve as a wake-up call. Even under the worst-case scenarios, human-caused warming will not push the Earth beyond the bounds of habitability. But it will create conditions unlike anything seen in the 300,000 years our species has existed — conditions that could wreak havoc through ecosystems and communities. As Emily Judd, a researcher at University of Arizona and the Smithsonian specializing in ancient climates and the lead author of the study said, “As long as one or two organisms survive, there will always be life. I’m not concerned about that. My concern is what human life looks like. What it means to survive.”
Juneau Glacial Outburst Floods – Missoula Floods Analog?
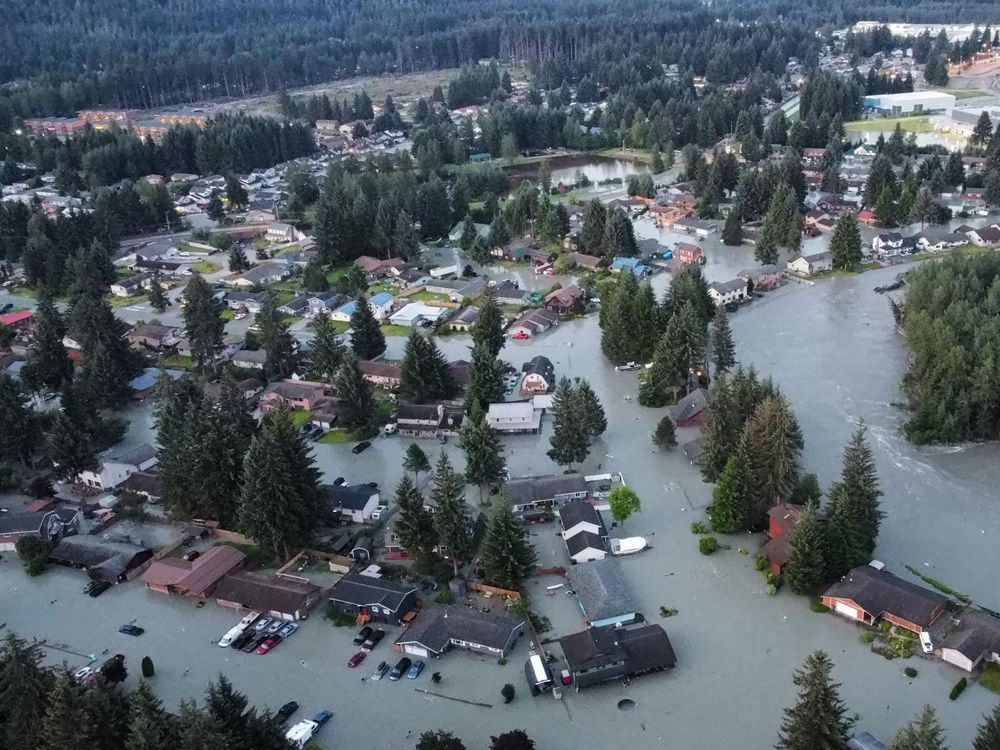
Around 3:30 in the morning on August 6, the first arrivals made their way into the emergency shelter officials had set up in a school gym in Juneau, Alaska. “We were getting people in that were covered in glacial silt and soaking wet in their pajamas,” says Robert Barr, Juneau’s deputy city manager. “It was folks who lived so far inland, so far away from the river, that they just weren’t expecting to get water.” Over the previous 24 hours, the Mendenhall River, which runs through Alaska’s capital city, had risen to a peak of about 16 feet above normal levels. The flood inundated houses and apartments blocks away from the riverbank, surprising residents who lived so far away from the river they didn’t expect flooding—even after a warning. For the second year in a row, the city experienced a record-breaking flood in early August. But these floods didn’t follow heavy rains or snow. Instead, they came as a lake held back by the nearby Mendenhall Glacier released more than 14 billion gallons of water in a matter of hours. This year, says Barr, “we were super lucky that we didn’t have any casualties or deaths as part of this.” Before 2011, the glacial lake contained in Suicide Basin near Juneau had never drained catastrophically. Located on the flank of the Mendenhall Glacier, the lake now drains multiple times every year, sending a pulse of floodwater rushing down the river into Juneau with little warning. These floods can destroy homes, apartment buildings and roads. They’re part of a global phenomenon of catastrophic glacial lake outburst floods. “They’re really dynamic systems we don’t know much about,” says Bri Rick, a glacial scientist at the Alaska Climate Adaptation Science Center who studies glacial lake outburst floods in coastal Alaska and published an inventory of past Alaskan floods in 2023. “There’s no hard and fast rule about how they’ll behave.” Glacial lake outburst floods are a reality for the estimated 15 million people living downstream from glaciers worldwide. They occur anywhere glaciers exist, like the Andes in South America, the Himalayas in Asia, the European Alps, Iceland and Alaska. Outburst floods, just one of many natural disasters influenced by climate change, have killed thousands of people and caused millions of dollars in damages. A warming climate and receding glaciers are making it increasingly uncertain how flooding from these glacial lake systems will behave in the future. These sudden releases occur when a dam holding back water adjacent to a glacier fails. These dams can be made either of the ice of the glacier itself or of rocky material deposited by a past glacial advance. In coastal Alaska, ice-dammed lakes are most common. They’re so potentially dangerous, Rick says, since the water melts a larger and larger channel in the glacial ice as it flows. Because of this, during an outburst flood the contents of the lake swell downstream rivers suddenly—sometimes without warning for those in the deluge’s path. They’re more surprising than normal flooding caused by heavy rain or snow, Rick says, as precipitation-caused flooding is slower because the rain “has to move through the entire basin, whereas an entire lake moves down the channel at once” during an outburst flood. Studies like Rick’s, which inventoried glacial lakes in Alaska to reveal potential flooding hazards, are key to helping those living in the potential path of a glacial flood understand the risks they face. However, Rick says that before her work, the most recent attempt at cataloging potential outburst floods in Alaska was done in 1971. Even this 50-year-old inventory was incomplete. It was biased toward events with human impacts, since modern technologies like satellite imagery that could detect floods in remote locations weren’t yet available to scientists. Rick is part of an effort by scientists around the world to create databases as an important tool in better understanding patterns of outburst floods. “These inventories are there to provide context,” says Simon Cook, a glaciologist at Scotland’s University of Dundee who has worked on similar databases for South American glacial lakes. But, until recently, inventories based on modern remote sensing techniques just didn’t exist, he says. With studies like his and Rick’s, though, that’s changing. In the recent Alaska inventory, Rick was able to identify 60 percent more outburst floods in Alaska over the 35 years between 1985 and 2020 than had previously been documented over a 100-year timeframe. “We do now have quite a powerful bank of data to try to get a feel, really, for how frequent these events have been and whether there’s any sort of pattern to that,” says Cook. To create the recent Alaskan catalog, Rick spent hours poring over satellite imagery to find glacial lakes that could send water rushing downstream. After identifying their location, Rick generated a time-lapse for each lake using Google Earth Engine, and then clicked through the images one-by-one looking for signs of a flood event. For each of the 121 lakes in her inventory, this took about 30 minutes. After spending so many hours looking at these images, Rick says, “I’d close my eyes and just see lakes draining.” In the Alaska study, Rick and her fellow researchers found that the number of outburst floods seems to be holding steady in Alaska since 1985, and the average flood size is decreasing. But this regional-scale pattern doesn’t mean individual downstream communities are necessarily safer. Like the recent onset of climate-caused damaging floods from Suicide Basin in Juneau, Rick cautions, “any individual lake can have very different trends or experiences.” The risk to human life and property at any given location downstream of a glacier is dependent on a multitude of physical and social factors unique to the locale, says Caroline Taylor, a glacial lake outburst floods researcher at Newcastle University in England. Researchers like Taylor calculate the risk to any given downstream location by considering the physical conditions of the lake and surrounding terrain, the infrastructure and people in the path of a potential flood, and how prepared a community is to predict and deal with an outburst. For example, an outburst flood
Exploring Another Montana Flood
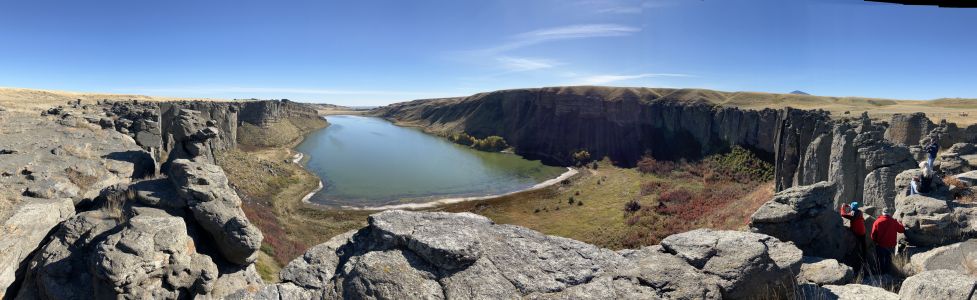
One of Montana’s other floods has been tickling the curiosity of some of our members.. This grew into a desire to plan a trip over to the upper Missouri River to see the channels from the diversion damming and outburst of Glacial Lake Great Falls. Thus, a reconnaissance was planned for 4 people. As the word got out everyone wanted to go and we wound with 14 souls on a loosely planned ‘let’s go over and see what we can find’ trip. The map below portrays Lake Great Falls when the Keewatin lobe of the Laurentide Continental Ice pushed the Missouri River out of its banks, pushing it south to the ice margin until the ice sealed off on the Bears Paw Mountains, then rapidly snaked off a sub lobe that sealed off on the Highwood Mountains. The lake began to fill to about 600 feet deep over Great Falls. It burst catastrophically at least once, creating the mile wide 500-foot deep Shonkin Sag (AKA Big Sag). This history appears to be a little more complicated than that as we turned up places where the last flood cut previous flood gravels. MBMG Special Publication 122: Geology of Montana, vol. 1: Geologic History by IAFI member DR Larry Smith is an excellent read for the details. This is a flood channel in soft rock (Cretaceous shale and sands). The lakes along the flood channels are endorheic (allows no outflow to other, external bodies of water or groundwater) so equilibrate by evaporation and are salty like the sea. The presence of these is a major clue the swale or drainage they are in is a flood channel. This is a flood channel in Shonkinite, a peculiar, dark igneous rock that would be basalt if it were not greatly enriched in potassium. Importantly it forms the columnar jointing common in basalt making it subject to plucking and the formation of retreat cataracts and geometry like the Washinton scablands. Note the column size. These are 5 to 10 feet in diameter and weigh many tens of tons but still the high surface area makes them subject to plucking if you have enough water moving quickly. We extracted a piece of Shonkinite gravel with blebs of white felspathoid syenite (like feldspar but having a different structure and much lower silica content) exsolving from Shonkinite magma like oil from water in salad dressing We stayed at Fort Benton, the historic steamship terminus on the Missouri river. Much of this is on private land and the landowner graciously allowed access to our group after being forced to close it due to trash and bad behavior. Lynne Dickman was the persistent silver tongued devil that made this happen. In all this was a very interesting reconnaissance of one of the other Montana floods. Article by Jim Shelden, President, Glacial Lake Missoula Chapter of Ice Age Floods Institute
Discovery Park bluffs tell the story of Seattle’s glacial history

The cliffs at Discovery Park in Seattle offer a glimpse into the past, revealing layers of sediment left behind by advancing and retreating glaciers. This “layer cake” of rock tells the story of the Cordilleran Ice Sheet’s movement over the Seattle area during the most recent ice age. Before we dive into the specific layers, let’s rewind time. Over 100,000 years ago, Seattle’s climate was similar to today, with a river system flowing north. As the Earth’s climate cooled and became wetter, the Cordilleran Ice Sheet began to form in what is now southeast Alaska and British Columbia. Fast forward to around 19,000 years ago. The massive ice sheet reached the Canada-US border, pushing southward and splitting into two lobes. One lobe went southwest down the Strait of Juan de Fuca, while the other, the Puget Lobe, advanced south over the Puget Sound region. When this lobe reached Port Townsend, it blocked the existing river, forming a giant proglacial lake. By 18,000 years ago, the unstoppable ice sheet had overridden the lake and covered Seattle. Water was forced to find a new route south through the Chehalis River system. Around 16,900 years ago, the glacier reached its maximum extent, pushing all the way to Olympia and reaching thicknesses of up to 3,000 feet over Seattle. Now, let’s explore the layers of sediment visible at Discovery Park: Olympia Formation: This is the oldest layer, formed before the most recent glacial advance. It consists of sand, clay, and silt deposited by a river system in a non-glacial environment. Imagine a climate similar to Seattle’s present-day with streams, ponds, and backwaters. Lawton Formation: As the ice sheet approached Seattle, a lake formed at the edge of the glacier. This layer is made up of dark clay deposited on the bottom of that lake. The fine-grained materials suggest deep, calm water. Esperance Formation: As the ice got even closer, the particles deposited changed. This layer consists of sand, with some gravel lenses, deposited by glacial meltwater in a high-energy environment. Vashon Formation: This layer, not visible at this specific location but found nearby, is the glacial till left behind by the retreating ice sheet. It’s a mix of all sorts of materials – clay, silt, sand, pebbles, and boulders – deposited as the glacier melted. These layers at Discovery Park serve as a record of Seattle’s glacial past, offering a window into a time when massive ice sheets ruled the landscape. Click here to read a more detailed article written by Dale Lehman, President of the Puget Lobe Chapter, about this interesting glacial feature.
Hike to Large Erratics in Gingko Petrified Forest State Park

In the approximate center of the state of Washington is the Gingko Petrified Forest State Park. And within the park is a trail, unnamed, which offers opportunities to view evidence of the terrific capabilities of the Ice Age Floods to transport huge boulders and leave huge deposits of rock material. The trail is off I-90 at exit 136 to the town of Vantage. After exiting the freeway travel north through Vantage for almost a quarter mile and turn right onto Recreation Dr. There is a sign to “Rocky Coulee Recreation Area.” It’s the old Highway 10 leading down to Lake Wanapum. This 0.3 mile section of road from the turn is bisecting the western margin of an eddy flood bar. The bar is about 0.75 mi in length and 0.25 mi in width. It extends down to the recreation area. At the end of this 0.3 mile section of road is the trailhead on your left. Parking is available here. A Discover Pass is required. The road continues another quarter mile to the Rocky Coulee Recreation Area at which restroom facilities are available. You could also park there. The trail starts along a slope above the Rocky Coulee. The bedrock here is all dark colored basalt. But deposited intermittently on the ground are light colored granitic rocks. Because they are not from this bedrock and are of a different composition than the basalt they are termed erratic. Where did they come from and how did they get here? That is the story of this hike. The last outburst floods from Glacial Lake Missoula are thought to have happened about 15,000 years ago. Huge chunks of ice, icebergs, broke away and carried whatever rocky material they had impounded during years of emplacement. The icebergs likely came from the Cordilleran Icesheet as it failed. This material was often granitic boulders and cobbles. Erratics here might have come from Rocky Mountain “Belt” bedrock or from glacial ice transporting Columbia-Okanogan valley bedrock and alluvium. When the flood waters made their way to this location, some 200 miles from their origin near Pend Oreille, they encountered some constrictions in the terrain which slowed their progress. The most significant constriction affecting this area was Wallula Gap, 70 miles south. It was less than 2 miles in width. That sounds like a wide gap but it was enough to prevent free flowing of these huge floods. Another, but less significant one, was Sentinel Gap, 10 miles to the south. Upon the waters slowing, eddies formed and the icebergs got caught up in those. The temporarily impounded water backed up onto these slopes. This resultant body of water has been named Glacial Lake Lewis. Inevitably some of the bergs became grounded on the slopes in the area. The highest erratic here is at 1,263 ft. The maximum water depth was about 800 ft. That’s about 700 ft above the existing water surface of Lake Wanapum reservoir. In the adjacent Schnebly Coulee erratics go up 3.5 miles. It’s estimated Lake Lewis existed and then drained within a few days, probably no more than a week. Upon the water finally receding through the gaps, with much less energy than upon arriving, the icebergs were left behind. Over time the bergs melted leaving behind their loads. These slopes are littered with hundreds of erratics. As you walk you can spot them along the trail. Most of them are small to moderate in size: less than 3ft². About a quarter of a mile into the hike the road starts taking a 90° right turn. As you round that turn you can see that Rocky Coulee below you takes a sharp turn to the south before again traversing to the east. It is quite possible the slope on which we are standing, a landslide, blocked the coulee and constricted that tributary’s water flow. As the water rose high enough to overcome the barrier it found a newer path to the south of its original course. We’ll see more evidence of the landslide up the trail. In another quarter mile, about half way to our destination there is a group of erratics on the right of the trail. There is more than one within a 3 foot radius so that makes it a cluster. But with fewer than 10 rocks in a 30 foot transect and the ground surface not greater than 3 feet higher than the surrounding terrain this is defined as a Low Density Erratic Cluster. This is a definition derived by a Central Washington University Masters student, Ryan Karlson in 2006. It incorporates a definition given by Bruce Bjornstad. At this same location you can look to the north and see a head scarp from a translational landslide. This whole hike is on a landslide. Looking to the east you can see hummocky terrain. So, there are 3 signs of landslide on this hike: head scarp, hummocky terrain, and the irregular tributary channel seen earlier. The soil here is very thin and nutrient poor: lithosol. It forms from weathered basalt, windblown loess, and volcanic ash. (You can still find ash from the 1980 Mt St. Helens eruption). It mainly supports a few species of sagebrush and bunchgrass along with seasonal wild flowers. Among the fauna found here are deer mice and ground squirrels. There are abundant Elk droppings you will see when leaving the trail to reach the destination erratic. I have seen a video of an Elk herd I would estimate was well over a hundred, perhaps two or three hundred running across nearby terrain. It was incredible! Traveling up the trail another quarter of a mile you can see the destination erratic off to the left on the trail. It will take about a quarter of a mile walk off the trail to get to it. This erratic is the single largest one in the park area at 85 ft². It’s 10 feet long and 8.5 feet high. It lies in a High Density Erratic Cluster, so
Unearthing the Secrets of Spokane Valley: A Recap of the IAFI June Jamboree
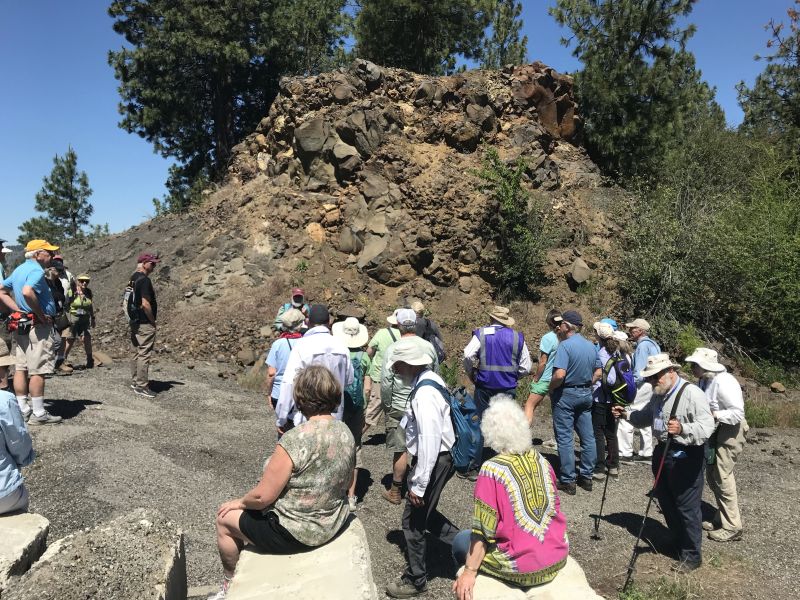
This year’s IAFI June Jamboree delved into the fascinating geological history of Spokane Valley, contrasting it with the iconic Grand Coulee and Dry Falls, explored during last year’s Jubilee. Challenging the Landscape: Unlike the open spaces of Dry Falls, Spokane Valley presented a unique challenge – showcasing evidence of Ice Age Floods within an urban environment. Our chapter tackled this brilliantly, organizing hikes and car caravans departing from convenient public parks and commercial areas. Evening Explorations: The program’s highlights included captivating lectures. Professor Emeritus Dean Kiefer shed light on J Harlen Bretz’s Spokane associates, while renowned naturalist Jack Nesbit brought the story of the first Columbian Mammoth discovered near Latah Creek in the 1800s to life. Celebrating Success: The Jamboree culminated in a relaxed gathering at Mirabeau Meadows. Registrants, leaders, and participants exchanged insights and experiences, with a resounding appreciation for the chapter’s efforts. Comparisons were drawn, highlighting how our Spokane Valley exploration continued the excellence of the Puget Lobe’s outing at Dry Falls last year. A Delicious Finale: The grand finale was a catered Longhorn Barbecue overflowing with delicious food. Everyone left satisfied, with many even taking home doggie bags to savor the flavors afterward. Check out more images from the event in this Google Photo Album. Meet the Masterminds: Linda & Mike McCollum: This dynamic professor emerita and a research geologist duo co-led tours and car caravans, sharing their latest research on the Spokane area’s Ice Age Floods, and shaping the Jamboree’s theme. Michael Hamilton: A gifted geologist, Michael led hikes and the bus trip, encouraging questions and offering honest answers. Don Chadbourne & Chris Sheeran: Don, the chapter treasurer, managed logistics with expertise, while Chris, our media and registration guru, ensured a smooth experience. Melanie Bell Gibbs: A past president and national board member, Melanie oversaw participant check-in and badge distribution. Dick Jensen: Dick handled bus transportation and provided crucial support throughout the Jamboree. Jim Fox: The chapter vice president secured speakers and offered his assistance wherever needed. We also owe a great deal to the participant volunteers who proved invaluable in assisting us in all our efforts. Through the combined efforts of many the IAFI June Jamboree was a resounding success, fostering exploration, education, and a deeper appreciation for the Spokane Valley’s unique geological heritage. Being present with so much information and conversation among such extensive expertise was to witness the scientific process in action. Meeting people from other chapters was particularly nice, putting faces with names we know. We all learned a lot.