Glacial erratics of the Puget Lowland
Strewn among the forests of the Puget Lowland are an impressive array of Glacial Erratics. Although technically erratics include small pebbles and even sand grains in till, people tend to get the most excited by really big erratics- those the size of a house or building. Whatever their size, glacial erratics often reveal the direction of the ice flow that ripped them from their source region and deposited them at their resting place. Erratics can also help determine the thickness of the ice sheet that deposited them. In the Seattle area, it is relatively straightforward to determine the provenance of erratics containing quartzite, as that rock can not be found anywhere in the Olympics, the Cascades, or in the native bedrock of the Puget Lowland. Quartzite, which is durable and resistant to weathering, is commonly found in river valleys of central British Columbia and in the glacial tills of the Puget Lowland. However, granodiorite erratics found in the lowland and on the slopes of the Olympics and Cascades can be more difficult to decipher. The granodiorite in these erratics is chemically similar to rock bodies both in the British Columbia Coast Mountains and in the Cascades. In the mountains east of Bellingham, erratics found at 5,000 ft of elevation imply that the thickness of the Puget Lobe of the Cordilleran Ice sheet was at least 5,000 ft thick at that location. Maps showing the thickness of the Cordilleran Ice Sheet at various places in Western Washington are drawn, in part, by looking at the depositional altitude of erratics on ridges around the region. The two most massive erratics in the Puget Lowland are composed of Greenschist metamorphic rock. One of the giant erratics of Western Washington hides in the forest in Saratoga Woods Park on Whidbey Island. The Waterman erratic is 38ft high and has a circumference of 135 ft. Analysis of the rock shows that it is composed of Greenschist, a rock containing the low grade metamorphic minerals Chlorite and Epidote. The Greenschist chemically matches the rock of Mt. Erie, a prominent Roche Moutonée found 40 miles to the north on Fidalgo Island. An even larger erratic can be seen in a suburban neighborhood near Everett. The Lake Stevens erratic, 34 ft tall with a circumference of 210 ft, is considered the largest erratic in the Northwest, and possibly the largest erratic in the United States. This erratic is also composed of a Greenschist, although chemical analysis cannot give us a definitive origin for the big rock. There is similar Greenschist on the northern tip of Whidbey Island at Deception Pass, around Mt. Shuksan in the North Cascades, and also up the Fraser River in British Columbia. Article by Dale Lehman
The first people in the Americas
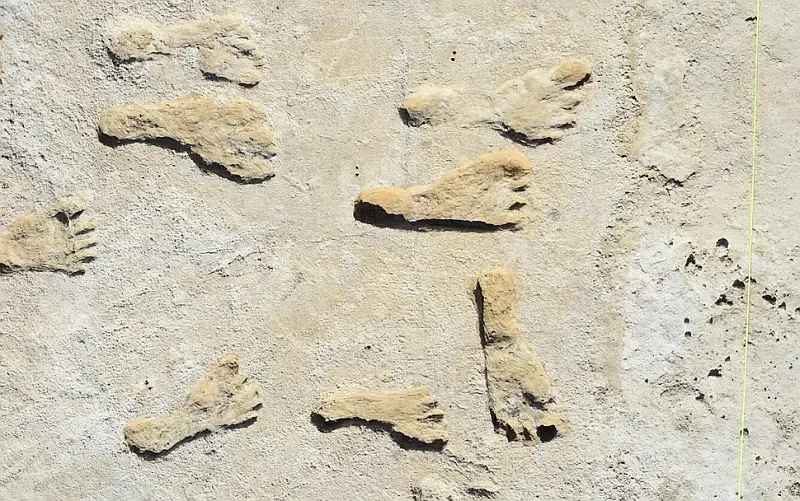
The first people to arrive in the Western Hemisphere were Indigenous Americans, who were descended from an ancestral group of Ancient North Siberians and East Asians. They likely traveled along the Bering Land Bridge by land or sea. When the first Americans arrived is a source of ongoing debate. Several studies suggest that a series of fossilized human footprints found at White Sands National Park in New Mexico date to sometime between 21,000 and 23,000 years ago. That dates them to the coldest part of the last ice age, the last glacial maximum (which lasted from around 26,500 to 19,000 years ago), when the northern part of the continent was covered in glaciers and ice sheets. Other controversial studies suggest even earlier dates. For example, dated stone artifacts in Chiquihuite Cave, in Mexico, to more than 30,000 years ago. However, it’s unclear if humans actually crafted these rocks or if they formed naturally that way, making the finding uncertain. Other studies go back much further. In 2017, a controversial study in the journal Nature reported mastodon bones in California that may have been modified by humans around 130,000 years ago. However, other archaeologists have expressed concerns about the excavation of this finding and noted that other natural events or animals could have modified the bones. To put the 130,000-year-old date into context, the earliest evidence for Homo sapiens dates to around 300,000 years ago in Morocco, while the earliest evidence for a successful migration of humans into Asia was more than 100,000 years ago and the earliest evidence of successful human migration into Europe was around 55,000 years ago. Excerpted from Who discovered America? By Owen Jarus in LiveScience
Hanford site can now transform nuclear waste
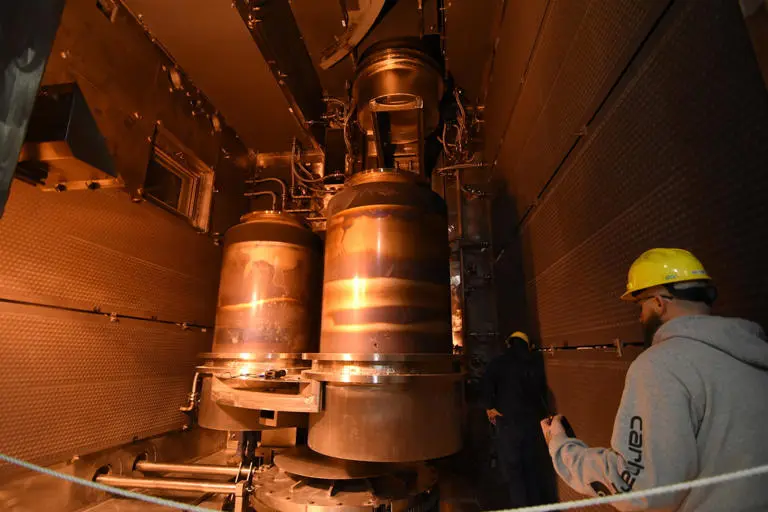
For much of the 20th century, a sprawling complex in the desert of southeastern Washington state turned out most of the plutonium used in the nation’s nuclear arsenal, from the first atomic bomb to the arms race that fueled the Cold War. Now, after decades of planning and billions of dollars of investment, the site is turning liquid nuclear and chemical waste at the Hanford Nuclear Reservation into a much safer substance: glass. State regulators on Wednesday issued the final permit Hanford needed for workers to remove more waste from often-leaky underground tanks, mix it in a crucible with additives, and heat it above 2,000 degrees Fahrenheit (1,000 Celsius). The mixture then cools in stainless steel vats and solidifies into glass — still radioactive, but far more stable to keep in storage, and less likely to seep into the soil or the nearby Columbia River. The long-awaited development is a key step in cleaning up the nation’s most polluted nuclear waste site. Construction on the Hanford Waste Treatment and Immobilization Plant began in 2002. “We are at the precipice of a really significant moment in Hanford’s history,” said Casey Sixkiller, director of the Washington State Department of Ecology, in a video interview. Article by Cedar Attanasio reprinted from MSN
Amazing Forensics Solve 150-Million-Year Pterosaur Mystery
Two tiny pterosaur fossils, each smaller than a mouse, have finally solved a puzzle that has mystified paleontologists for decades. The perfectly preserved hatchlings, nicknamed “Lucky I” and “Lucky II,” were discovered in Germany’s famous Solnhofen limestone formations and reveal both how they died and why juvenile flying reptiles dominate this fossil record. The Tragic Discovery Both Pterodactylus hatchlings, just one to two weeks old when they perished, share a telling characteristic: broken wing bones with identical fracture patterns. The clean, slanted breaks to their humerus bones suggest the same type of twisting force killed them both 150 million years ago. University of Leicester paleontologist Rab Smyth and his team reconstructed their final moments through careful forensic analysis. The evidence points to a violent Late Jurassic storm that battered the tiny pterosaurs with winds so powerful their fragile wing bones snapped under pressure. The same storm then hurled their bodies into a saltwater lagoon, where churning waters quickly carried them to the bottom for rapid burial and exceptional preservation. Solving the Solnhofen Paradox The discovery resolves a long-standing mystery about the Solnhofen formations, which contain hundreds of pterosaur specimens but are dominated by juveniles. This seemed counterintuitive since young pterosaurs had more fragile bones and should be less likely to fossilize than adults. The research reveals this apparent contradiction actually makes perfect sense. The same catastrophic storms that killed vulnerable hatchlings created ideal conditions for their preservation. Adult pterosaurs, being stronger and more experienced, could survive the violent weather that proved fatal to their offspring. When adults eventually died under calm conditions, their remains would float and decompose before sinking, making fossilization unlikely. “For centuries, scientists believed that the Solnhofen lagoon ecosystems were dominated by small pterosaurs,” Smyth explains. “But we now know this view is deeply biased. Many of these pterosaurs weren’t native to the lagoon at all – they were inexperienced juveniles caught up in powerful storms.” Broader Implications This discovery transforms our understanding of pterosaur ecology and fossil preservation. Rather than reflecting true population dynamics, the juvenile-heavy fossil record represents a preservation bias created by extreme weather events. The findings also provide rare insight into Late Jurassic climate patterns, suggesting violent storms regularly impacted ancient ecosystems. The research exemplifies how modern paleontology combines traditional fossil analysis with environmental reconstruction. By examining preservation circumstances alongside the bones themselves, scientists can extract far more information from specimens and avoid misinterpreting ancient ecosystems. Published in Current Biology, this work offers a new framework for understanding how environmental factors influence fossil records – reminding us that every preserved specimen tells a story not just about the creature’s life, but about the dramatic events that led to its preservation across deep time. AI adapted from Original reporting by Michelle Starr, ScienceAlert about research by Rab Smyth and colleagues, University of Leicester..
1954 Mystery Quake Came from ‘Eerily Quiet’ Cascadia Subduction Zone
A new study finds a 1954 earthquake that rattled Northern California was likely caused by the infamous Cascadia Subduction Zone. The linking of the magnitude 6.5 quake with this particular seismic zone is important, because the Cascadia Subduction Zone, which stretches from northern California to Vancouver Island in Canada, is not known to give off many small or medium quakes. In seismology parlance, the fault is “locked,” or unmoving. The last known rupture was a massive magnitude 9 earthquake in 1700 that caused landslides and an enormous tsunami that was so powerful that waves over 16 feet high (5 meters) hit Japan, according to the U.S. Geological Survey. In modern times, though Cascadia “has been eerily quiet,” one of the study’s co-authors said in a statement. “We don’t have smaller earthquakes, and that’s not something you usually see in subduction zones.” That lack of small earthquakes in the decades since scientists started monitoring faults with seismometers and other instruments means they have a limited sense of Cascadia’s behavior. But the new research suggests that the fault has possibly ruptured on a smaller scale within recent memory. The study re-evaluated a Dec. 21, 1954 quake that shook the Humboldt Bay, California area just before noon. Residents reported strong, rapid ground motion that toppled chimneys. Researchers had previously proposed 14 different epicenters for the quake. The new study honed in on Fickle Hill, a small forest community along a two-lane road not far from the larger city of Arcata. The researchers also found that the fault that caused the quake likely ruptured between about 6.8 miles and 8.7 miles (11 to 14 kilometers) below the surface. Arcata sits in a particularly interesting earthquake region. It’s not far from the offshore “triple junction,” where the Pacific oceanic plate meets the Gorda oceanic plate and the North American continental plate. It’s also in the transition zone between the San Andreas fault zone (where the North American plate and the Pacific plate slide past each other) and the Cascadia Subduction Zone (where the oceanic Juan de Fuca plate dives under the North American plate). Most quakes near Humboldt originate on the Gorda plate. But the Fickle Hill quake didn’t, the researchers found. Based on the depth and the direction of the earthquake waves, the quake instead seems to have come from the Cascadia Subduction Zone. That makes Fickle Hill one of only two known possible Cascadia quakes since 1700. (The magnitude 7.2 Cape Mendocino quake in 1992 might also have been a Cascadia quake, though that is still hotly debated.) The finding would suggest that Casadia does not have to rupture all at once, causing devastatingly huge quakes, but that it can also break in segments, creating smaller temblors. Though the new research doesn’t yet translate to any predictions of what Cascadia might do in the future, reviewing existing data can help improve scientists’ understanding of the area’s tectonics, ultimately helping improve their estimation of the earthquake hazard for the Pacific Northwest. Excerpted from a Live Science article by Stephanie Pappas published August 20, 2025
1925 PacNW Articles about J Harlan Bretz
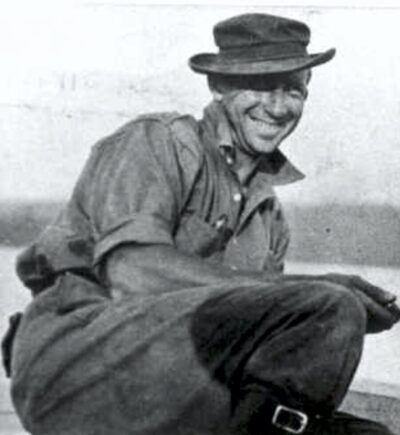
In the course of writing her weekly “100 Years” column for the Ferry County View, Madilane Perry recently came across a couple of 1925 local newspaper articles about J Harlan Bretz and his work and theories from that time that she felt many of our members would find interesting. Click on each of the images to read the articles. We want to thank Madilane for sharing these interesting insights into the local perspectives of that time. Madilane Perry is a native of Ferry County WA with a long history in the area. Her byline is seen atop her weekly “100 Years Ago” column in the Ferry County View. She has dedicated countless hours to the Ferry County Historical Society and the local museum. She has extensive knowledge of the local history and has expertise in identifying artifacts and historical collections.
DNR Releases Stunning Dry Falls Visualization
DNR’s Daniel Coe collaborating with Joel Gombiner has produced a stunning arial oblique visualization and poster showing incredible detail of the Dry Falls geologic complex. The DNR webpage announcing the release also shows additional materials like sliders illustrating differences in image capture resolution and grayscale vs. color representation, as well as Bretz’s scaled line drawing sketch comparing the Dry Falls Complex to Niagara Falls.
IAFI Cheney-Spokane College Student Research Grants Available
The Cheney-Spokane Chapter of the Ice Age Floods Institute is offering $500 grants to support geologic fieldwork on Ice Age flood research in the Pacific Northwest. Open to undergraduate and graduate students in the U.S. and Canada, proposals are due by April 15 and must focus on Quaternary flood geology. Applications are reviewed for scientific merit, practicality, and impact. Lab costs for dating techniques are eligible, but funding excludes equipment, salaries, tuition, and travel. Submit your proposal (up to 4 pages) to cheneyspokane@iafi.org Progress report & field photos due the following February. 2025 IAFICS Student Research Grant Guidelines
“The Next Big One” – NOVA|PBS Short Video
NOVA|PBS is sharing a short 5:16 min) video, THE NEXT “BIG ONE” – The Next Big Earthquake Could Sink Parts of the Pacific Northwest. It contains a brief explanation of the potential timing, causes, and some effects of the impending and widely-feared next Cascadia Earthquake Zone rupture. It’s worth a watch for most anyone in the PacNW.
Greenland’s Subglacial Surprises: How Subglacial Breakouts Might Have Shaped Ice Age Landscapes

Recent discoveries in Greenland are reshaping our understanding of massive flood events beneath ice sheets, offering compelling new perspectives on the formation of some Ice Age Floods-related features. Two recent studies highlight an unprecedented sub-glacial flood in 2014, where a staggering 90 billion liters of meltwater unexpectedly burst through nearly 91 meters (300 feet) of solid ice. This previously undocumented phenomenon in Greenland involved a massive volume of water punching upwards, fracturing the surface, and creating a 2-square-kilometer (0.77 square-mile) crater 85 meters (279 feet) deep. Satellite data revealed that the ice surface dropped dramatically after having bulged from water pressure. Evidence downstream showed a heavily fractured area with large ice boulders and a scoured ice surface, indicative of immense erosive power. This event challenges previous assumptions that the base of ice sheets is always frozen solid and provides critical insights into the destructive potential of sub-glacial meltwater. While the iconic Missoula Floods are well-established as a result of glacial lake outbursts, this Greenland discovery suggests that other, perhaps more localized or intermittent, sub-glacial flood breakouts could have played a significant role in shaping the landscape during past ice ages. Such events could explain certain geomorphological features that don’t neatly fit the Missoula Flood narrative, such as Moses Coulee and possibly much of the Upper Grand Coulee, opening new avenues for research into the diverse origins of Ice Age Floods-related landforms. AI-condensed from articles in LiveScience by Ben Turner and ScienceAlert by Michelle Starr