Ice Age Floods National Geologic Trail NPS Brochure
The next big project for the Ice Age Floods National Geologic Trail is to develop the official National Park Service (NPS) brochure. The standard park brochure that people receive when they visit most national parks has a map of the park or trail on one side and informational text and pictures on the other side about the park significance, visitor safety, and other information. Developing a brochure is usually done by the NPS Harpers Ferry Center, but because the Ice Age Floods National Geologic Trail is an affiliate, it is up to Lake Roosevelt, with the help of the its partners, to make it happen. Developing a brochure has three major components: 1) developing the map, 2) writing the accompanying text, 3) laying out the brochure. We’re working on creating a map that follows Harpers Ferry Center guidelines for readability and disability accessibility. Limiting the map to key locations and fine-tuning the route names are critical to creating a visually pleasing and usable map. At the Ice Age Floods Institute (IAFI) Spring board meeting, IAFI board members and NPS Superintendent Dan Foster identified several significant locations along the trail, then narrowed the list down to about 13 key sites. Institute members have been working on brief descriptions of each of these locations and a clear, yet concise overall flood story. They’ve also been gathering images to be included in the brochure. Once the map is completed and the informational text and pictures are in hand, we can start laying out the brochure. When we have a good draft of the layout we will send it out to our partners for review. We hope to have the brochure printed and distributed before next travel season. Denise Bausch Chief, Interpretation and Education Lake Roosevelt National Recreation Area Ice Age Floods National Geologic Trail
Frenchman Coulee Drone Video
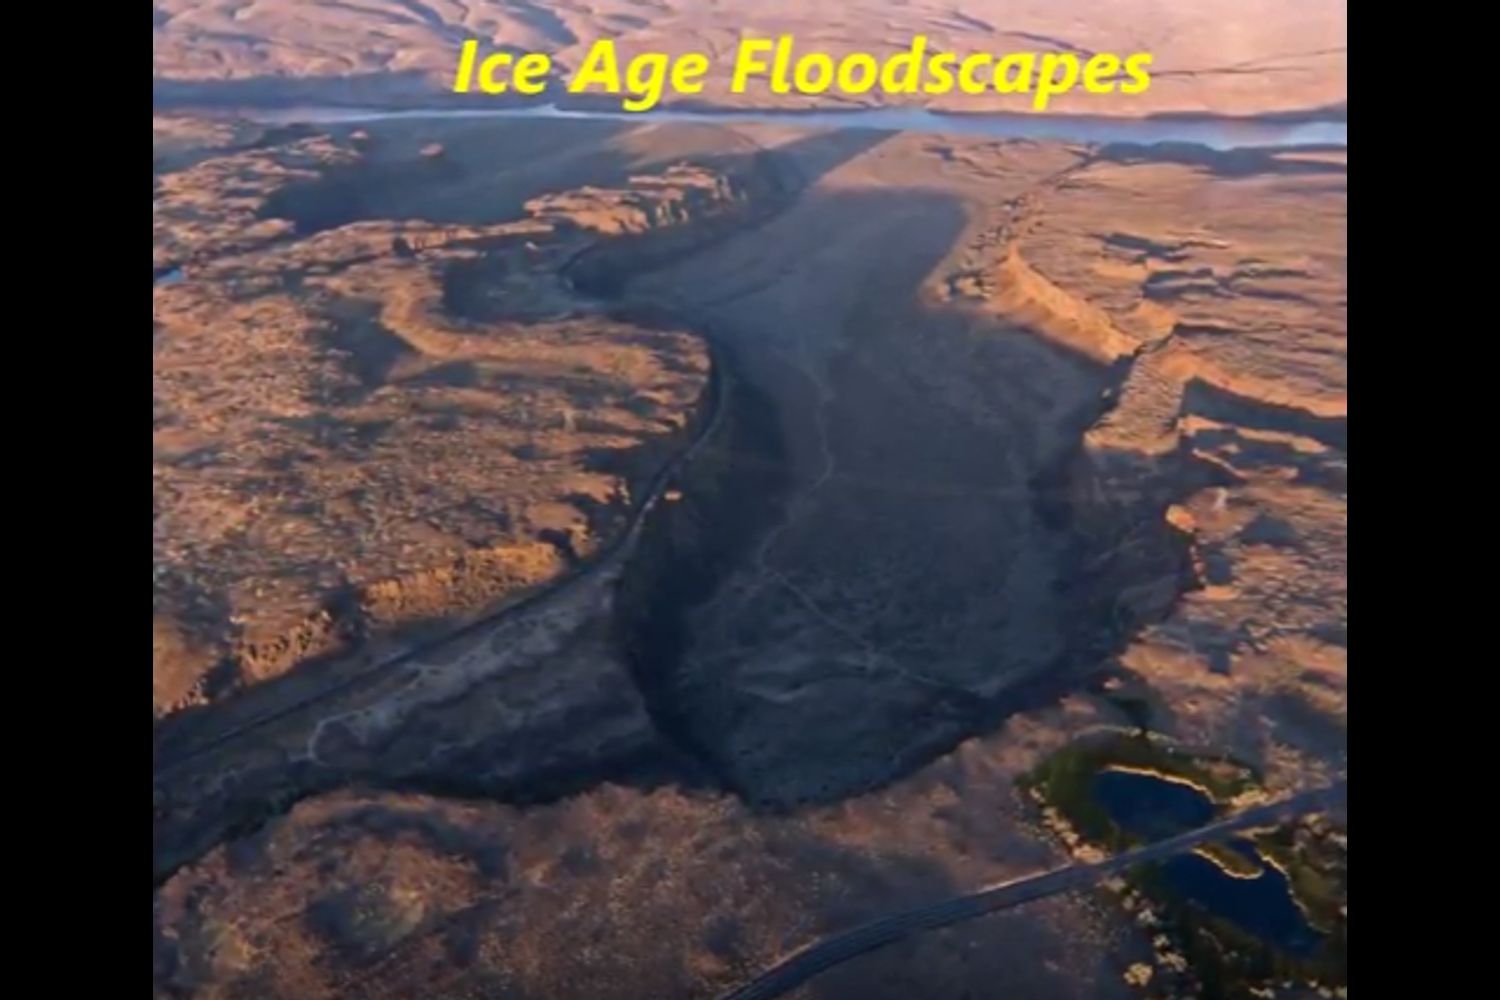
Bruce Bjornstad is at it again with his awesome Ice Age Floodscapes drone videos, this one from Frenchman Coulee. Watch it below and visit his Ice Age Floodscapes YouTube channel.for many more.
Bretz and His Floods Story – National Geographic
National Geographic has published an outstanding article, “Formed by Megafloods, This Place Fooled Scientists for Decades”, about J Harlan Bretz and his outrageous, fantastical theories of a landscape shaped by huge floods. Most Ice Age Floods aficionados are generally aware of the story, but this one is so detailed and well written it’s worth reading for the story-telling value alone. Please see: This National Geographic site:
Lake Lewis High Water Markers Installed
In April, 2017, Lake Lewis members George Last and Bruce Bjornstad worked with Friends of Badger volunteers Jim Langdon (Trail Master) and David Beach to install Markers showing the Lake Lewis high water marks on Badger and Candy Mountains near Richland, Washington. The Lake Lewis Chapter donated $300 to the Friends of Badger Mountain to purchase the two faux erratics engraved with “Lake Lewis Maximum Elevation 1250 Feet”. One of the markers was installed along the Sagebrush Trail on Badger Mountain, and the other along the Candy Mountain Trail. It was a glorious day!
Getting Our Palouse Falls “WOW” Story Out
A few of us met two years ago in August to decide if we should start our own chapter. We asked the question, “How do we get the word out to see how much interest there is?” We decided the best way to do this was to the attend the upcoming local fairs – Wheatland Communities Fair in Ritzville over Labor Day weekend, the Palouse Empire Fair outside of Colfax the following weekend and the Adams County Fair in Othello the weekend after that. We were fortunate to still be able to get booth space for the first two fairs and to share with the Coulee Corridor (at no cost) for the last one. We quickly rounded up pictures, maps, and books to fill our first booth. We talked to a lot of interested people and signed up new members for our chapter. This year we decided to do the three weeks of fairs again. The Coulee Corridor allowed us to use part of their booth again to help out our fledgling chapter – we will be able to go solo next year. There are a number of good reasons to take the time and expense to do these fairs. We recognize existing chapter members. We advertise our upcoming lectures. We promote our fall bus tour. We sign up new members. We share our flood story. This year we had time to create a more professional booth including local rock samples. This was a good draw for the young visitors as well as the adults. We also had samples of Mount St. Helens ash from the local area and Yakima. It was a great dialog starter – Why are the two samples different? Answer – the local ash is finer and the Yakima ash is coarser because the heavier material dropped out closer to the mountain. We also met with people who were visiting from outside the flood path or had just recently moved in from out of the area. I would ask them if they were familiar with the Missoula floods. Some knew nothing and others just a little. I would tell the story, pointing to the map showing Glacial Lake Missoula and the flood path. The one superlative I would hear over and over again was “WOW”. It reminded me of just how much of a “WOW” area we live in and how easy it is to forget that when you have lived in it all your life. Yes we do live in a “WOW” area and the local fairs have been a great venue to get our “WOW” story out to the public. Lloyd Stoess, President Palouse Falls Chapter, IAFI
Earth in the Next Billion Years
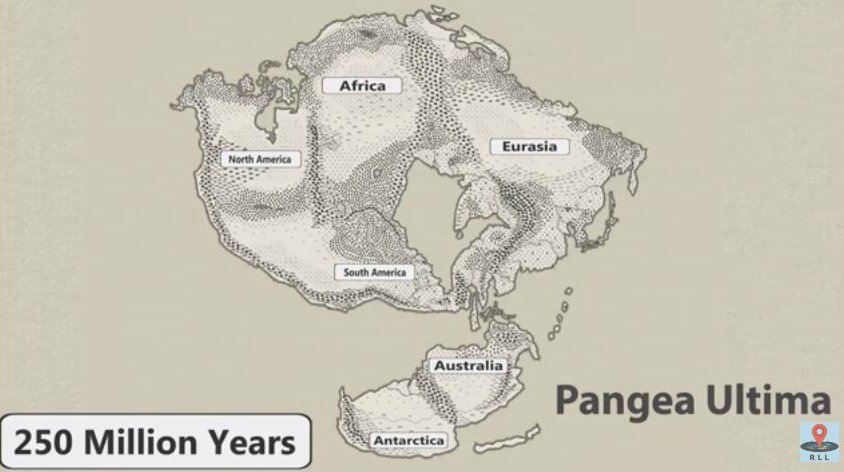
No one can ever say for sure what the future will bring, but this new video has summed up all the science-backed predictions that we can reasonably make about how Earth will change over the next 1 billion years. It’s highly unlikely that anyone will be around to see most of these changes come to pass, so consider this an exclusive front-row seat to a world where supercontinents reign supreme, Mount Everest is no longer the tallest mountain on our planet, Earth enters another glacial period regardless of current global warming trends. and then the Sun becomes a lot hotter. Just another reason we should be glad we live at the time we do. Reposted from Science Alert and RealLifeLore
Beryllium-10 dating of late Pleistocene megafloods and Cordilleran Ice Sheet retreat
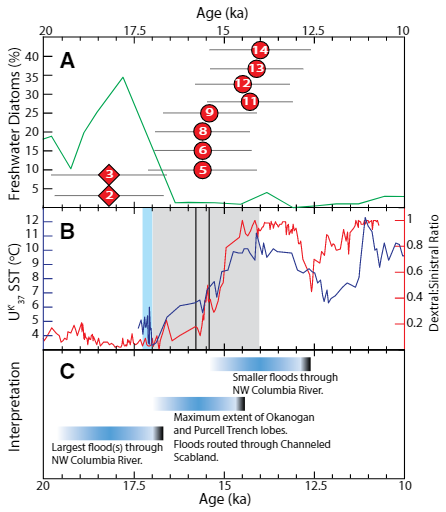
Balbas et. al. use cosmogenic beryllium-10 dating methods to further constrain the timing of ice sheet retreat, as well as the potential pathways for megafloods from both Lake Missoula and Lake Columbia. Read this fascinating Geology article summarizing their findings. Balbas2017 – Missoula Flood Chronology In summary, our new chronological information suggests the following: (1) Blockage of the Clark Fork river by the Purcell Trench lobe by ca. 18.2 ka, resulting in Missoula floods following the Columbia River valley. (2) Blockage of the Columbia River valley by the Okanogan lobe before 15.4 ± 1.4 ka, which shunted Missoula flood water south across the Channeled Scablands. (3) The final Missoula floods at ca. 14.7 ± 1.2 ka, signaling retreat of the Purcell Trench lobe from the Clark Fork valley, yet these floods entered a glacial Lake Columbia still impounded by the Okanogan lobe. (4) Down-Columbia floods at ca. 14 ka from breakouts of glacial Lake Columbia, signaling the retreat and final damming of the Columbia Valley by the Okanogan lobe
German Marshall Fund Fellows Visit Gorge Floods
On May 6th a group of 6 German Marshall Fund (GMF) Fellows from Europe and Russia got a taste of the Ice Age Floods story as they toured the Gorge, shepherded by Krystyna Wolniakowski, the Executive Director of the Columbia River Gorge Commission and a past-fellow herself. This was their last day to do some sightseeing before heading home after three weeks of intensive presentations and meetings with experienced business and political leaders. After being wowed by the scenic beauty and amazing wines of the Gorge they came to Rowena Crest for a brief discussion about the Ice Age Floods at this incredible vantage point. IAFI Gorge Chapter leader, Lloyd DeKay, used maps and illustrations and pointed out several local Floods features to help tell our story of the 1000′ deep floods that roared across the landscape and through Rowena Gap, crashing against and over this promontory on their devastating path to the sea. These Fellows came away awed by the many wonders of the Gorge, and feeling like they had the crowning experience of all the GMF groups touring the States and Europe. The GMF-funded Fellowship Program is a leadership development program intended to help build networks and develop effective transatlantic relationships and engagement for future world leaders. Each year 70+ GMF Fellows are stringently chosen from hundreds of up-and-coming business and political leaders from both sides of the Atlantic. Each small “class” is supported for 6 months of focused distance learning and 24 days of first-hand travel and experiences as they meet and learn from high-level business and political leaders. It was humbling for us to have played a small part in contributing to the experiences of this dynamic group of future world leaders.
Washington’s Ice Age Floods – ESRI Story Map
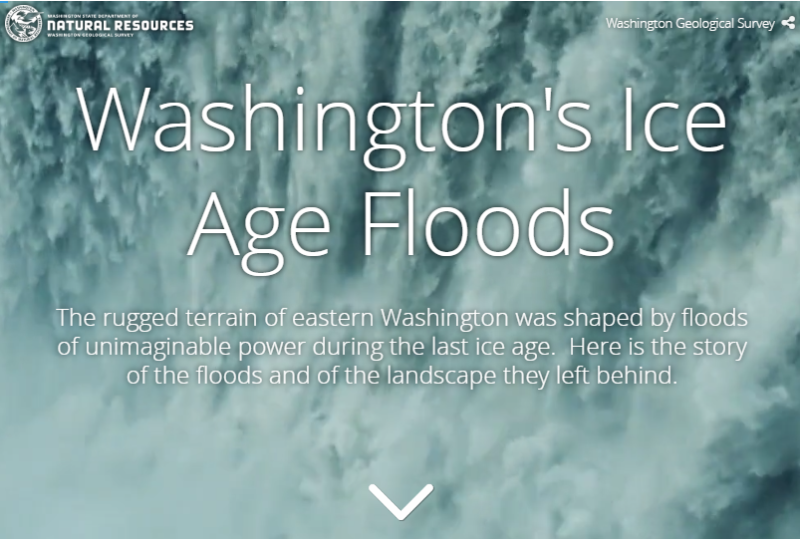
The Washington Geological Survey (formerly the Division of Geology and Earth Resources) has just released an ESRI story map about the Ice Age Floods in Washington. The story map: “tells the story of cataclysmic outburst floods that shaped the landscape of the Pacific Northwest during the last ice age. With imagery, maps and video, this story map follows the devastating deluge of the Missoula floods as it tore across the landscape, from its origins in western Montana to its terminus at the Pacific Ocean. Sites along the Ice Age Floods National Geologic Trail are featured, with an emphasis on flood features in Washington State.” Entitled Washington’s Ice Age Floods, it is best viewed on a desktop or laptop computer. Mobile devices will not show all of the content. It is navigated by scrolling your mouse through the slides. There are a few animated sections that may take a second or two to load. [weaver_iframe src=’https://wadnr.maps.arcgis.com/apps/Cascade/index.html?appid=84ea4016ce124bd9a546c5cbc58f9e29′ height=600 percent=100]
WA-DNR Website Features Phenomenal LIDAR Images
Washington State Geological Survey is collecting, analyzing, and publicly distributing detailed information about our state’s geology using the best available technology – LIDAR – an acronym for Light Detection And Ranging. The main focus of this new push for LIDAR collection is to map landslides, but there are innumerable additional benefits and applications of this data both inside and outside of the field of geology. A number of amazingly beautiful and revealing images are featured on the WA-DNR Flickr website, along with a trove of information about the technology and it’s applications. LIDAR is a surveying method that measures very precise distance to a target by illuminating that target with a pulsed laser light and measuring the reflected pulses with a sensor. Differences in laser return times and wavelengths can then be used to make digital representations of the target. LIDAR is expensive, but it can easily remove vegetation/grass/trees as it uses an emitting source and interferometry criteria to find the “last echo return” that is assumed as the ground, even in very dense scenarios (forests, corn fields, etc). LIDAR uses ultraviolet, visible, or near infrared light to image objects. It can target a wide range of materials, including non-metallic objects, rocks, rain, chemical compounds, aerosols, clouds and even single molecules. LIDAR is widely used for many different applications. Some (but by no means all) of those uses include: Geology and Hazards, Forestry, Graphics, Navigation, Meteorology and Fir,e Land-use planning, Archaeology and Agriculture. In geology, bare earth models allow closer study of geomorphology, which is the study of the origin of the topography of the earth. Floods, faults, landslides, erosion, and glaciers leave their mark on the landscape, and while these marks can be hidden by dense vegetation, they can’t hide from LIDAR. LIDAR can be used in the field of archaeology to find things hidden by the forest canopy. Large features that would be indistinguishable on the ground are readily apparent in a LIDAR survey, leading archaeologists to sites they might not have otherwise found. For example, intensity returns can be used to detect features just below the surface that affect plant growth.