Waning Pleistocene Ice Sheet Affected Megaflood Paths and Local Shorelines
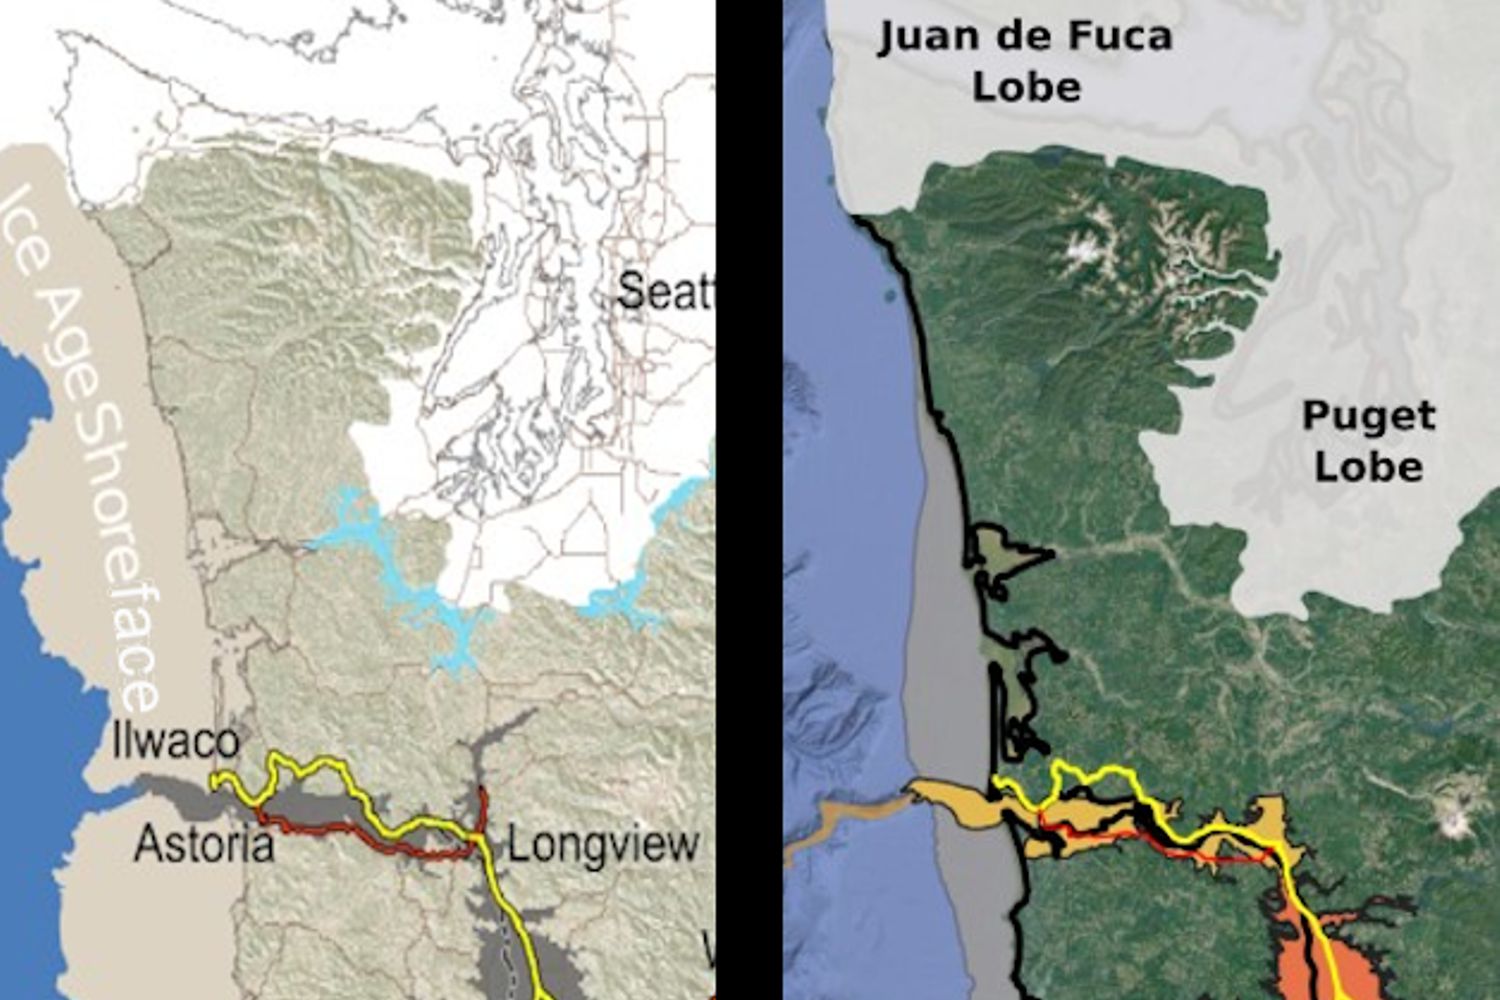
Have you ever thought about the how the weight of the ice-age Cordilleran ice sheet might affect the underlying Earth’s crust. There is strong evidence that the crust was depressed hundreds of feet beneath the ice, and since the crust is relatively thin and rigid over a plastic aesthenosphere, that also caused the crust for some distance beyond the ice margins to tilt toward the ice sheet. A new modeling study explored how changes in topography due to the solid Earth’s response to ice sheet loading and unloading might have influenced successive megaflood routes over the Channeled Scablands between 18 and 15.5 thousand years ago. The modeling found that deformation of Earth’s crust may played an important role in directing the erosion of the Channeled Scabland. Results showed that near 18 thousand year old floods could have traversed and eroded parts of two major Channeled Scabland tracts—Telford-Crab Creek and Cheney-Palouse. However, as the ice-age waned and the ice sheet diminished 15.5 thousand years ago, crustal isostatic rebound may have limited megaflood flow into the Cheney–Palouse tract. This tilt dependent difference in flow between tracts was governed by tilting of the landscape, which also affected the filling and overspill of glacial Lake Columbia directly upstream of the tracts. These results highlight one impact of crustal isostatic adjustment on megaflood routes and landscape evolution. Other studies have shown that relative ice-age sea levels were over 300 feet lower worldwide due to the volume of water locked up in ice sheets. Typical depictions of the shoreface extent are generally based on a 300 ft. depth contour, but there is strong evidence that shorelines were up to 200+ ft. higher than present day in marine areas adjacent to ice sheets, again because the crust was depressed by the weight of the ice sheer. A more accurate representation might show a much narrower shoreface in ice-free areas nearer to the ice sheet margin. However, in the Haida Gwaii Strait at the margin of the ice sheet the lower thickness of the ice sheet meant that local shorelines were as much as 550 feet lower than they are today. This was because the much greater thickness of the center of the ice sheet served to push upwards areas at the edge of the continental shelf in a crustal forebulge. It is now widely thought that these emergent ice-free land areas might have provided a viable coastal migration corridor for early peoples making their way to the Americas from Asia during the Pleistocene.
Mammoth and Horse DNA Rewrite Ice Age Extinctions
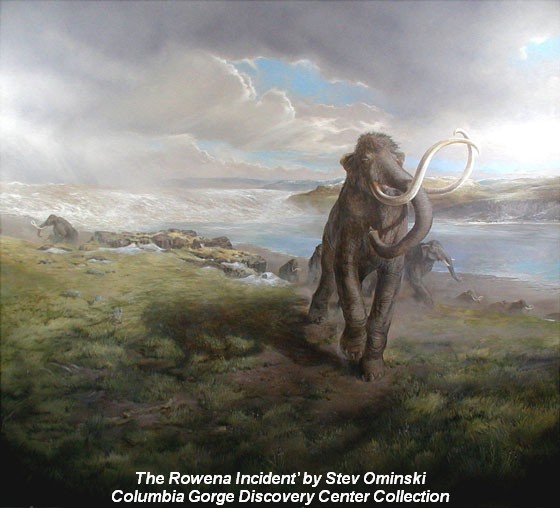
New research reveals the ancient animals survived some 8,000 years later than previously thought Frozen soil samples collected around a decade ago are rewriting our understanding of iconic Ice Age animals like the woolly mammoth. The soil samples were pulled from Canada’s permafrost in the early 2010s, but no work on them had been published until recently. A new analysis of the DNA samples reveals that woolly mammoths, wild horses and steppe bison were around as recently as 5,000 years ago—some 8,000 years later than previously thought, according to a study published this week in Nature Communications. Scientists reconstructed the ancient ecosystem using radiocarbon dating of plant material trapped in the soil in combination with microscopic genomic sequences from animal species. Their results showed something unexpected: Large mammals like mammoths and horses were already on the decline before the climate warmed. The scientists found evidence of woolly mammoth and North American horse DNA as recently as 5,000 years ago, which means the animals held out until the mid-Holocene. Excerpted from the Smithsonian Magazine article by Corryn Wetzel
23,000 Year Old Human Footprints Found in New Mexico

Articles in Science Alert and the New York Times report on a well documented age for many sets of human footprints as old as 23,000 years in the ancient lake shore sands of White Sands, New Mexico. “The footprints were first discovered in 2009 by David Bustos, the park’s resource program manager. Over the years, he has brought in an international team of scientists to help make sense of the finds. Together, they have found thousands of human footprints across 80,000 acres of the park. One path was made by someone walking in a straight line for a mile and a half. Another shows a mother setting her baby down on the ground. Other tracks were made by children.” Beginning in 2019, two United States Geological Survey (USGS) research scientists, Dr. Jeffrey Pigati and Kathleen Springer, began working on the site and found ancient seeds of ditch grass associated with various sets of footprints. The oldest footprints so far have been found in seed beds radiocarbon age-dated as old as 22,800 years, and the youngest footprints dated to about 21,130 years ago. Some scientists still have concerns the seeds might have absorbed older carbon from the lake waters. But in general this research is strongly indicative that humans were present in the Americas long before the generally accepted 15,600-year-old footprint found in Chile or the 13,000 year age of human tools found near Clovis, NM. If humans were well established in New Mexico 23,000 years ago, they must have started spreading down from Alaska long before that. “That starts to wind back the clock,” said Dr. Reynolds of Bournemouth University. Some researchers feel the migration might have been along the coast during the last major ice advance of the Pleistocene, while others argue people could have traveled inland more than 32,000 years ago, before Ice Age glaciers reached their maximum extent and blocked off that route. Regardless of the possible migration route, this new evidence opens up new possibilities that humans may have been present in our local area even before the earliest of the Ice Age Floods, about 18,000 years ago. While the floods could have wiped away most traces of early people in the area, the window of human habitation may be much greater than scientifically documented to date.
Chicxulub Asteroid Tsunami ‘Megaripples’
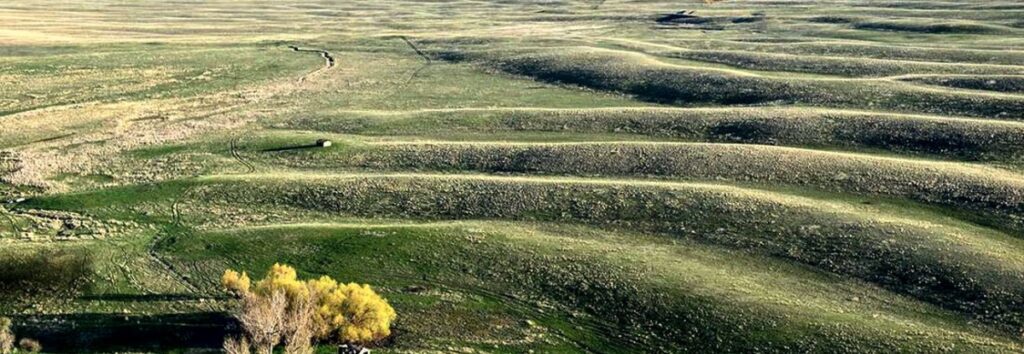
In what may be the most dramatic mass extinction in Earth’s history, an asteroid impacted our planet 66 million years ago near what is now Chicxulub on the Yucatan Peninsula. The resulting hellscape extinguished 75 percent of then living species – including all non-avian dinosaurs. Over the last few years, scientists have discovered many more traces of this cataclysmic impact, providing us with ever greater details of its extreme aftermath – from world-encircling dust to wildfires up to 1,500 kilometers (930 miles) from the impact site. In 2019, a team found fossil records of the immediate hours after, including evidence of debris swept up by the resulting tsunami. Now, researchers have discovered enormous megaripples engraved by the tsunami in sediments 1,500 meters (5,000 feet) below what is now central Louisiana. By analyzing seismic imaging data for central Louisiana, gained from a fossil fuel company., the team determined the imprinted ripple crests form a straight line right back to the Chicxulub crater and their orientation is consistent with the impact. These megaripple features have average wavelengths of 600 meters and average wave heights of 16 meters making them the largest ripples documented on Earth. Compare that to the largest Camas Prairie megaripple at 289m x 17m. Modelling of this monstrous tsunami suggests its waves would have reached a staggering 1,500 meters high (nearly 1 mile) after the Richter scale 11 megaearthquake triggered by the collision. The aftereffects would have been particularly devastating in the regions surrounding the impact site, sweeping sea life onto land and land life into the sea. “Tsunami continued for hours to days as they reflected multiple times within the Gulf of Mexico while diminishing in amplitude,” the team wrote. What carved out the ripples we can still detect today were the forces from the massive walls of water smashing into the shallow shelf near the shores, and reflecting back towards their source. Excerpted from: sciencealert.com/tsunami-megaripples-from-the-dinosaur-killing-asteroid-impact-discovered-in-louisiana Read another article at: https://www.sciencetimes.com/articles/32252/20210713/dino-killer-space-rock-left-fossilized-megaripples-mile-high-giant.htm
WA Geology Releases Stunning Lidar Images
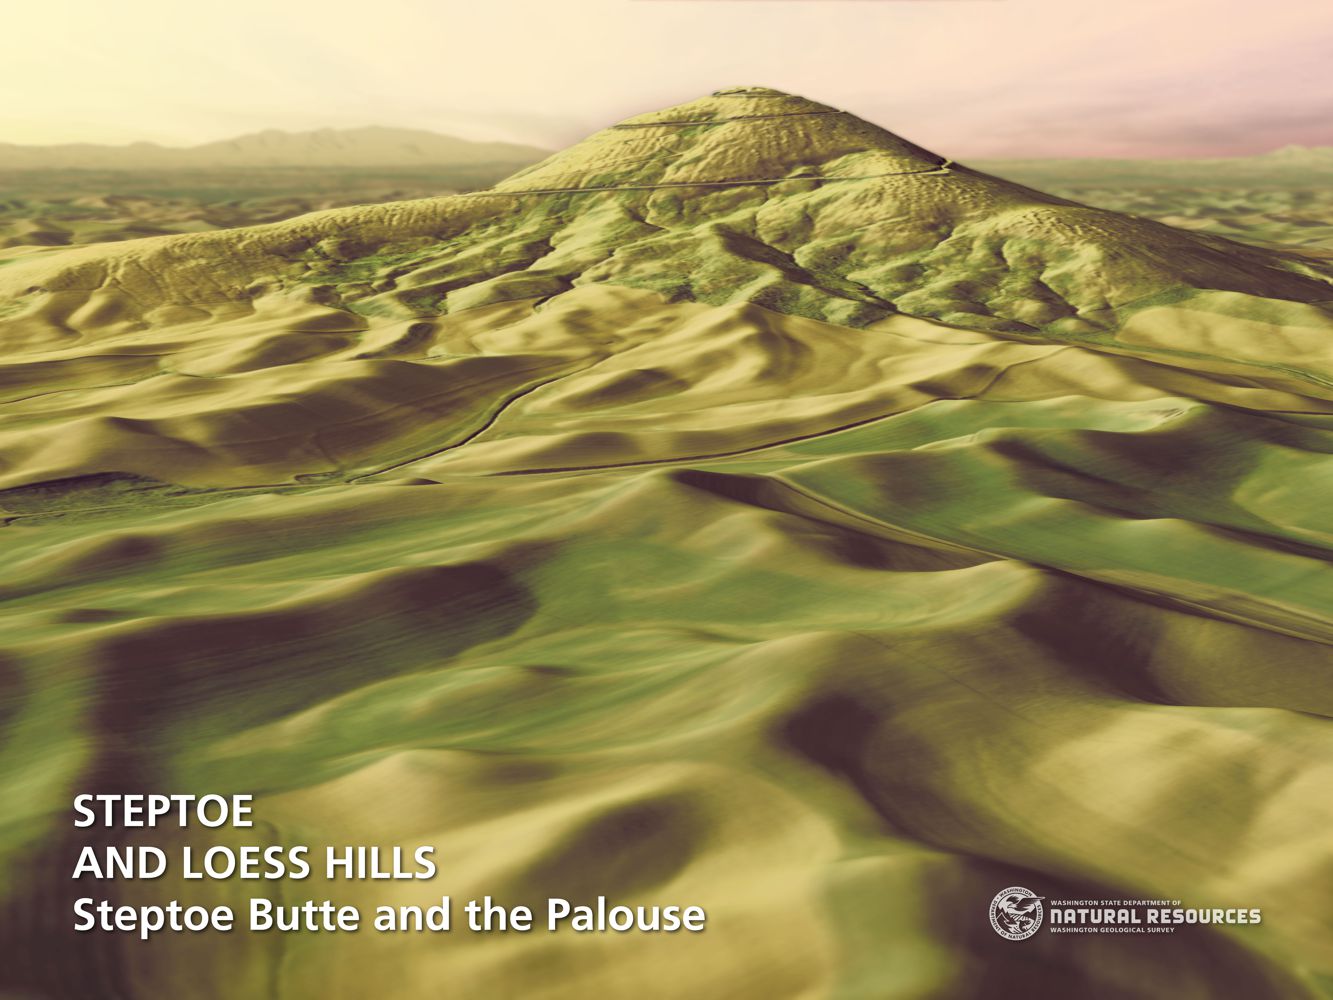
The Washington Geological Survey (WGS) has released 50 high-resolution lidar-derived images of the State’s geology and geomorphology through the Washington State DNR’s Flickr page. The images are available in 16:9 format (7,200 x 4,050 pixels) and 4:3 format (7,200 x 5,400 pixels). Ten of the images are new (see below) and 40 of them were previously available as screen wallpaper (at a lower resolution). Additionally, WGS has released several full-resolution lidar image series that reveal the State’s geology. These images are great for earth science presentations, learning about lidar, and for using as digital wallpaper. They are also large enough to support large-format printing. Here are direct links to the image galleries:
The Washington 100 Geotourism Guide

Check out this video about the Washington 100, a cool new geotourism website by the Washington Geological Survey featuring 100 places to experience amazing geology in Washington State. Then explore the website itself at wa100.dnr.wa.gov
New Saber-Toothed Cat Species May Have Hunted Rhinos in America
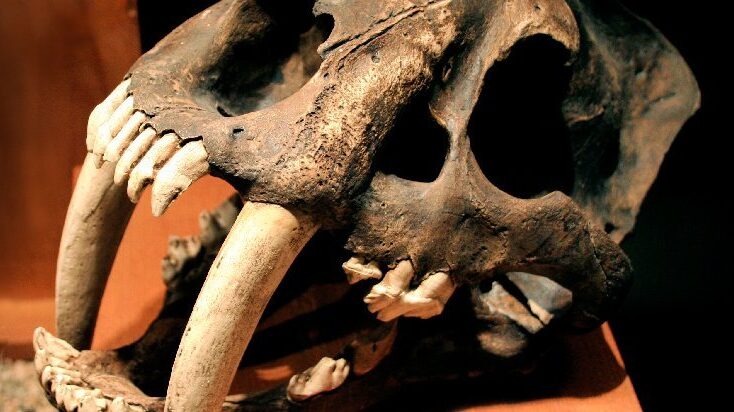
Using detailed fossil comparison techniques, scientists have been able to identify a giant new saber-toothed cat species, Machairodus lahayishupup, which would have prowled around the open spaces of North America between 5 and 9 million years ago. One of the biggest cats ever discovered, M. lahayishupup is estimated in this new study to have a body mass of some 274 kilograms (604 pounds) or so, and possibly even bigger. It’s an ancient relative of the well-known Smilodon, the so-called saber-toothed tiger. A total of seven M. lahayishupup fossil specimens, including upper arms and teeth, were analyzed and compared with other species to identify the new felid, with the fossils collected from museum collections in Oregon, Idaho, Texas, and California. Upper arms are crucial in these cats for killing prey, and the largest upper arm or humerus fossil discovered in the study was about 1.4 times the size of the same bone in a modern-day lion. That gives you an idea of just how hefty and powerful M. lahayishupup would have been. “We believe these were animals that were routinely taking down bison-sized animals,” says paleontologist Jonathan Calede from Ohio State University. “This was by far the largest cat alive at that time.” Rhinoceroses would have been abundant at the same and may have been animals that M. lahayishupup preyed on, alongside camels and sloths significantly bigger than the ones we’re used to today. Peering back so many millions of years into the past isn’t easy, and the researchers say that a more detailed saber-tooth cat family tree is going to be needed to work out exactly where this species fits in. The findings also open up some interesting evolutionary questions about these giant cats. “It’s been known that there were giant cats in Europe, Asia, and Africa, and now we have our own giant saber-toothed cat in North America during this period as well,” says Calede. “There’s a very interesting pattern of either repeated independent evolution on every continent of this giant body size in what remains a pretty hyper-specialized way of hunting, or we have this ancestral giant saber-toothed cat that dispersed to all of those continents. It’s an interesting paleontological question.” Excerpted from SCIENCE ALERT article by DAVID NIELD8 MAY 2021
DECIPHERING THE CHANNELED SCABLANDS FIELD WORK CONTINUES
In August, Scott David, a postdoctoral researcher and Karin Lehnigk, a 2nd year PhD candidate from the University of Massachusetts visited the scablands for a week to do field studies. Karin was in search of granite erratics. Samples of these were taken to be processed for Beryllium-10 exposure dating, a robust geochemical technique which enables researchers to determine how long the object sampled has been sitting on the surface of the Earth. This information combined with computer simulations of a range of flood sizes is to test the hypothesis that the earliest floods through the Cheney-Palouse Scabland Tract were also the largest. Scott was in search of potholes. Measuring the geometry of potholes and the rocks that comprise them in a variety of locations, he is using these measurements in numerical and physical modeling experiments to explore what erosion mechanisms could generate these massive features. Were they produced by retreating waterfalls, rocks circulating at the base of the flow, large scale turbulence, or some combination of these mechanisms? The results of the study should provide insight into how the remarkable canyons that comprise the Channeled Scablands formed. On a Friday afternoon, I met up with them in Ritzville and proceeded to some granite erratics near Cow Creek southeast of town to take samples. They spent the night at our house in Washtucna and were thrilled to have hot showers, a home-cooked meal and soft beds. The days before they slept in tents on a gravel parking lot. The next morning, Chad Pritchard from EWU joined us as we took measurements from four pot-holes along the south side of Washtucna Coulee between Washtucna and Hooper. They also took granite samples from the Midcanyon Bar near Lyons Ferry before returning to the Grand Coulee area. The results of their studies were not available at time of printing. Article by Lloyd Stoess in The Scablander
Model for a Missoula Flood
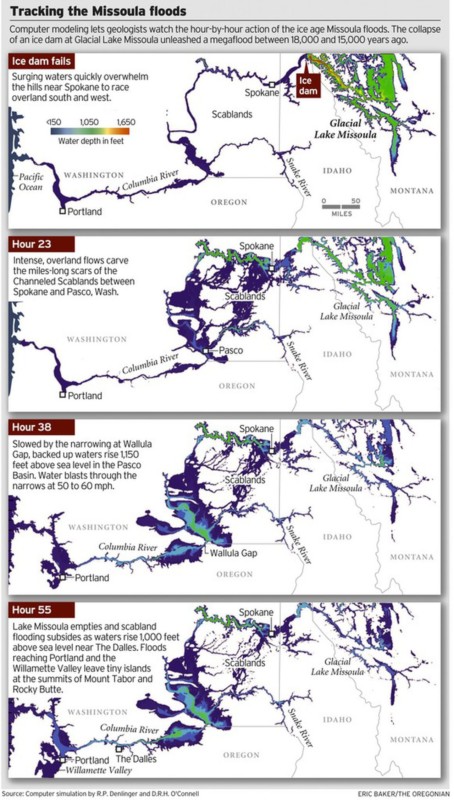
ICYMI (in case you missed it) — Floodwaters rise more than 1,000 feet as they slam into the Columbia River Gorge from the east. The torrent blasts through the narrows at 60 mph, carrying truck-size boulders and house-size icebergs. Reaching Portland, water loaded with gravel and dirt roils to a depth of 400 feet, leaving tiny islands at the summits of Mount Tabor and Rocky Butte. Geologists have spent decades piecing together evidence to tell the story of the great Missoula floods that reshaped much of Oregon and Washington between 18,000 and 15,000 years ago. Now scientists have found a way to travel back in time to watch the megafloods unfold, in a virtual bird’s eye view. Their computer simulation displays the likely timing and play-by-play action, starting with the collapse of an ice dam and outpouring of a lake 200 miles across and 2,100 feet deep. The computer model, developed by Roger Denlinger with the U.S. Geological Survey in Vancouver and Colorado-based geophysicist Daniel O’Connell, is filling gaps in scientific explanations of the floods and the baffling landforms they left, including the fabled Channeled Scablands — scars hundreds of miles long cut into the bedrock of eastern Washington and visible from outer space. The simulations also may help settle a lingering scientific controversy about what caused the repeating ice-age catastrophes. “It’s just really powerful visualization that gives a sense of the scale of the floods, how they came down through the channel system and backed up the big tributary valleys,” said Jim O’Connor, a hydrologist with the U.S. Geological Survey in Portland who has written extensively on the Missoula floods. He said the modeling work provides the first “really good information” on the timing of events. During the last ice age, a continent-spanning ice sheet built from massively expanded glaciers descended from the Canadian Rocky Mountains to reach deep into Washington, Idaho and Montana. Glacial Lake Missoula formed behind a miles-long dam of ice across what is now the valley of the Clark Fork and Pend Oreille rivers running from Montana to northeast Washington. The dam formed and collapsed dozens of times over a span of three thousand years. In the simulation of one of the largest possible floods, raging water quickly overwhelms the hills near Spokane and races overland to the south and west. The intense, overland flows carve the miles-long scars of the scablands between Spokane and Pasco, Wash. Thirty-eight hours later, swirling, mud-darkened waters converge at the narrowing of the Columbia at Wallula Gap, where the backed-up flow rises 850 feet above river level (1,150 feet above sea level). An immense volume of water blasts through the narrows at fire-hose velocity. Flow exceeds 1.3 billion gallons per second — a thousand times greater than the Columbia’s average flows today. Lake Missoula’s water, all 550 cubic miles of it, drains in 55 hours — less than three days — according to the model. At that time, the flood surge peaks in the Columbia Gorge at The Dalles, rising 950 feet above river level (1,000 feet above sea level), spilling over the gorge walls in places, and flooding the valleys of tributaries for miles upstream. Inundation of the Willamette Valley peaks on the seventh day after dam burst, in the simulation. Flooding reaches as far south as Eugene. Loaded with mud and gravel, the flood dumps sediment across the entire valley. Repeated floods build a layer 100 feet thick in Woodburn. Such a vast inundation, far greater than anything ever witnessed in historical time, seemed impossible to geologists in the 1920s, when J Harlen Bretz proposed that the scablands resulted from a catastrophic flood, not eons of gradual erosion. The idea didn’t gain mainstream acceptance until the 1960s. Since then, geologists have found evidence that Lake Missoula emptied catastrophically dozens of times during the last ice age. But controversy persists. A few scientists assert that the cataclysmic floods must have had multiple sources, not just an outburst from Lake Missoula. John Shaw of the University of Alberta in Edmonton, for instance, has proposed that an enormous reservoir beneath the ice sheet over much of central British Columbia boosted the flooding. The new simulation suggests that discharge from Lake Missoula alone would have been powerful enough. The simulated flood reaches peak stages all along its route that match the evidence visible today in sediment, with one big exception: At Wallula Gap, water levels in the simulation fell short by as much as 130 feet. “It’s pretty clear, if Lake Missoula is enough to hit all the other high water marks, you don’t need another source of water,” Denlinger said. Calculating the convoluted paths of such a massive flood requires an immense amount of number crunching. Simulating one flood requires more than 8 months of computer time, Denlinger said. But the computer simulation isn’t likely to end the debate. The fact that it can’t reproduce the maximum flooding at Wallula Gap leaves room for doubts. And some experts say there is direct evidence for an additional source of flood waters from beneath the ice sheet that covered the Okanagan Valley. “It is conceivable that other valleys in southern British Columbia contributed water to the scablands but the field evidence necessary to test these possibilities has not been fully documented,” said earth scientist Jerome-Etienne Lesemann at the University of Aarhus in Denmark. “There are a number of unanswered questions,” he said. “That makes the whole Channeled Scablands story a really interesting and intriguing geological puzzle.” Reprinted from The Oregonian, original article by Joe Rojas-Burke, 2010
Grand Coulee Dam Story
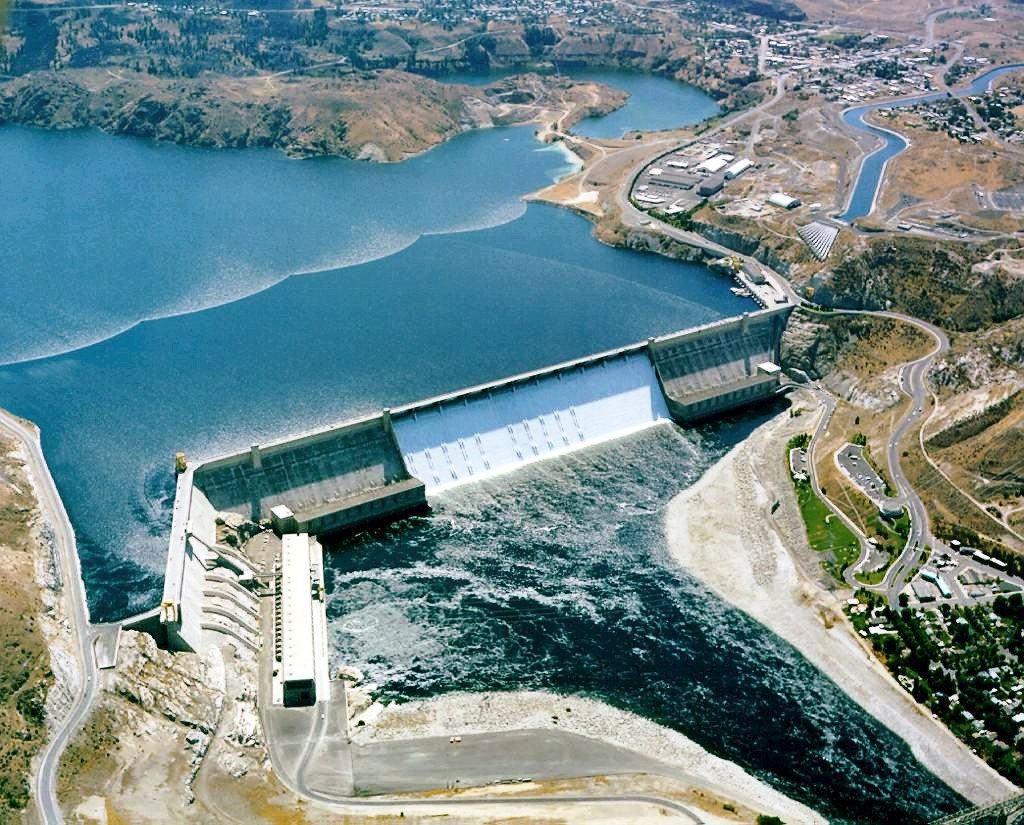
1918 story in the Wenatchee World that Bill Dietrich (former Columbian reporter and later with The Seattle Times) says in his wonderful 1995 book Northwest Passage — The Great Columbia River , “is probably the single most famous newspaper article in Pacific Northwest history. . . It is generally credited for launching the long debate about Grand Coulee Dam.” Students, fans and the mildly curious about any or all of: Grand Coulee Dam, The Columbia River, the massive Columbia Basin irrigation project, Eastern Washington in general, Washington state history, will find this article interesting.
